Bitcoin Elliott Wave technical analysis [Video]
![Bitcoin Elliott Wave technical analysis [Video]](https://editorial.fxsstatic.com/images/i/BTC-bullish-chart_XtraLarge.png)
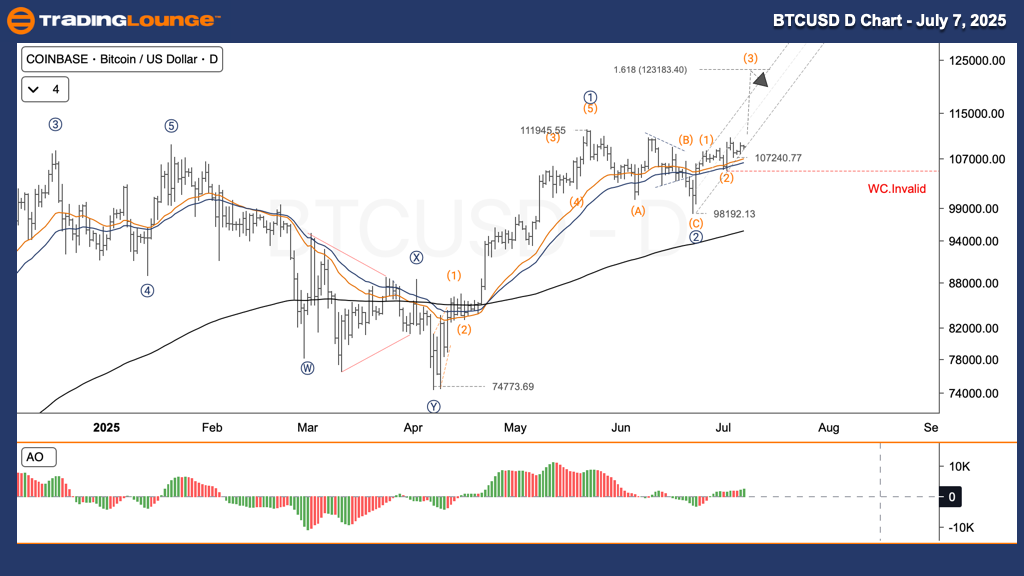
BTC/USD Elliott Wave technical analysis – Daily chart
-
Function: Follow Trend.
-
Mode: Motive.
-
Structure: Impulse.
-
Wave position: Wave 3.
-
Direction of higher degrees: Uptrend expected.
Trading strategy (BTC/USD - 07 July 2025):
Following the completion of wave (2) at 98,192 USD, Bitcoin has entered wave 3 of a new upward impulse. This move projects potential price action to the 1.618 Fibonacci extension at 123,183 USD.
Trading tips for swing traders
-
Strategy: Use minor dips as buying opportunities to ride wave 3 acceleration.
-
Invalidation Level: A break below 107,240 USD would negate the current wave count.
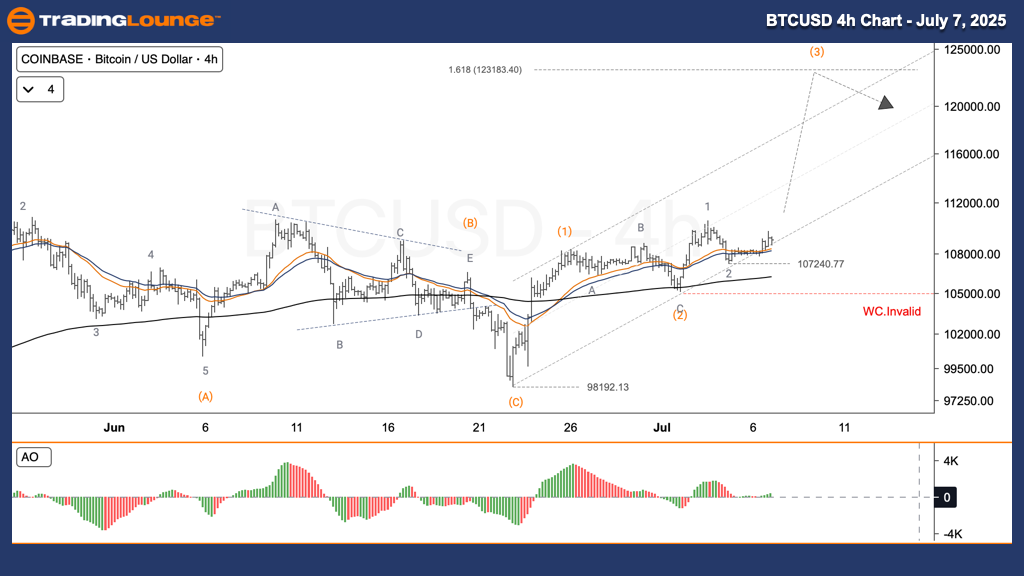
BTC/USD Elliott Wave technical analysis – Four-hour chart
-
Function: Follow Trend.
-
Mode: Motive.
-
Structure: Impulse.
-
Wave position: Wave 3.
-
Direction of higher degrees: Continuation to upside expected.
Trading strategy (BTC/USD - 04 July 2025):
The 4-hour chart confirms the daily structure. Bitcoin, post-consolidation at 98,192 USD, is now forming sub-wave 3 within a broader bullish move, with potential to hit 123,183 USD.
Swing trade plan
-
Buy minor corrections within the uptrend to join wave 3.
-
Invalidation Level: Drop below 107,240 USD will cancel this wave count.
Bitcoin Elliott Wave technical analysis [Video]
Author

Peter Mathers
TradingLounge
Peter Mathers started actively trading in 1982. He began his career at Hoei and Shoin, a Japanese futures trading company.


