Bitcoin Elliott Wave technical analysis [Video]
![Bitcoin Elliott Wave technical analysis [Video]](https://editorial.fxsstatic.com/images/i/BTC-neutral-object.png)
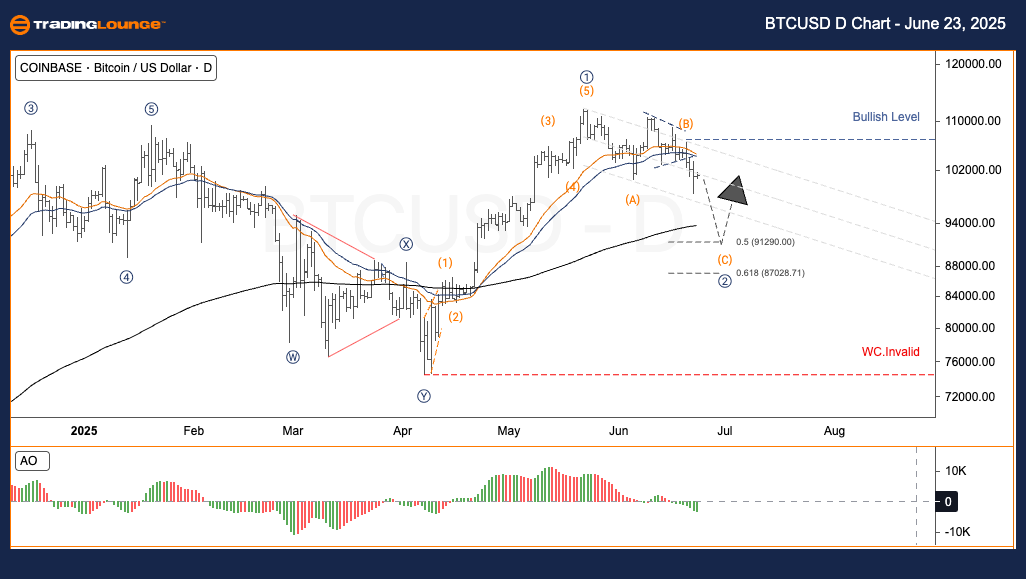
BTC/USD Elliott Wave technical analysis – Daily chart
-
Function: Counter Trend.
-
Mode: Corrective.
-
Structure: Zigzag.
-
Position: Wave C.
-
Direction (next higher degrees): Wave V of Impulse.
-
Invalidation Level:
BTC/USD trading strategy
Bitcoin recently reached a record high of $120,000. According to the Elliott Wave count, the price is now in a wave 2 correction. This corrective move is anticipated to test the Fibonacci retracement zone between 0.5 and 0.618 before resuming its upward trend in wave 3.
Trading strategies
-
Strategy
-
For Short-Term Traders (Swing Trade):
-
Monitor the 91,000 – 87,000 range for price testing and a potential reversal signal.
-
-
Risk Management
-
If the price moves below $87,000 without showing a reversal pattern, a reassessment of the wave structure is recommended.
-
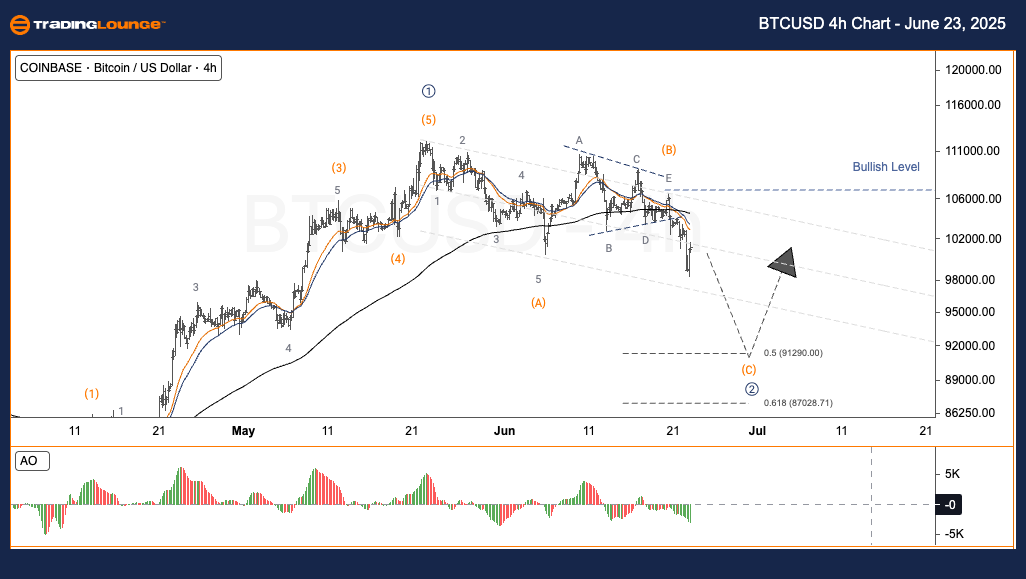
BTCUSD Elliott Wave technical analysis – Four-hour chart
-
Function: Counter Trend
-
Mode: Corrective
-
Structure: Zigzag
-
Position: Wave C
-
Direction (Next Higher Degrees): Wave V of Impulse
-
Invalidation Level:
BTC/USD trading strategy
Following its peak at $120,000, Bitcoin appears to be in a corrective wave 2 phase. The current analysis projects a move into the Fibonacci 0.5 to 0.618 range, where the price could potentially initiate wave 3 upwards.
Trading strategies
-
Strategy
-
For short-term traders (swing trade):
-
Look for the price to retest the 91,000 – 87,000 area and wait for a reversal signal to confirm entry.
-
-
Risk management
-
-
Should the price fall below $87,000 with no reversal, the analysis should be revisited.
-
Bitcoin Elliott Wave technical analysis [Video]
Author

Peter Mathers
TradingLounge
Peter Mathers started actively trading in 1982. He began his career at Hoei and Shoin, a Japanese futures trading company.


