Bitcoin Elliott Wave technical analysis [Video]
![Bitcoin Elliott Wave technical analysis [Video]](https://editorial.fxstreet.com/images/Markets/Currencies/Digital Currencies/Bitcoin/bitcoins-33758372_XtraLarge.jpg)
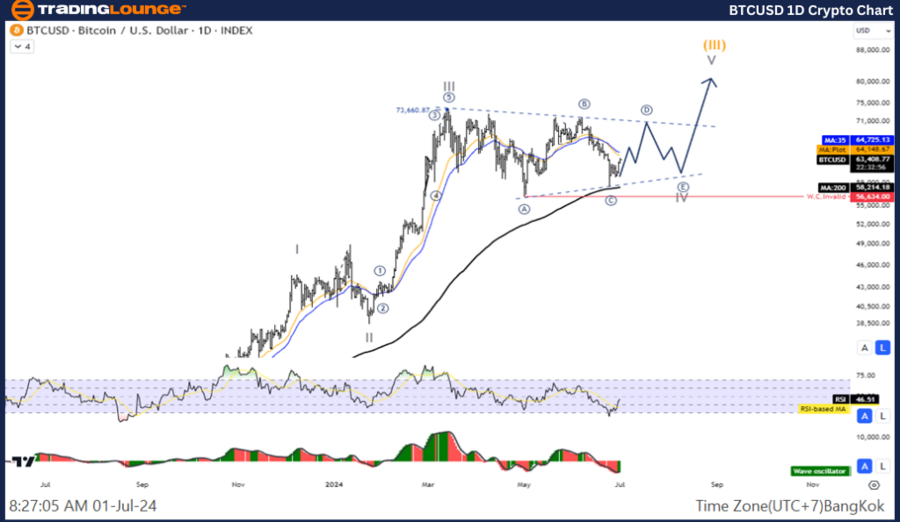
Elliott Wave Analysis TradingLounge Daily Chart.
BTC/USD Elliott Wave technical analysis
Function: Counter Trend.
Mode: Corrective.
Structure: Triangle.
Position: Wave ((C)).
Direction next higher degrees: wave IV.
Wave cancel invalid level: 56581.
Details: Movement within the Triangle pattern.
Bitcoin/ U.S. dollar (BTCUSD) Trading Strategy: Movement within the Triangle pattern of the fourth wave before increasing again in the fifth wave. We are still missing two more moves to complete the pattern, so wait for the correction to complete to rejoin the trend.
Bitcoin/ U.S. dollar (BTCUSD)Technical Indicators: The price is above the MA200 indicating a uptrend, The Wave Oscillator is a Bearish Momentum.
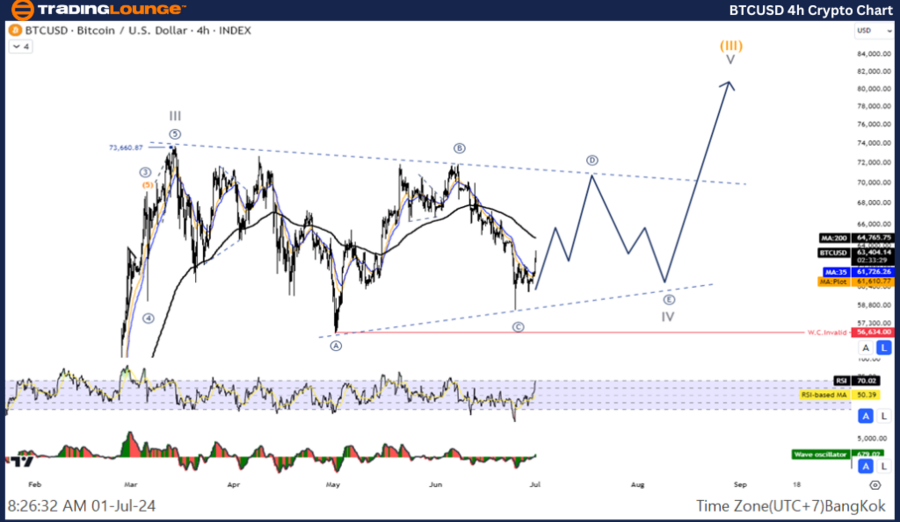
BTC/USD Elliott Wave four-hour chart
Function: Counter Trend.
Mode: Corrective.
Structure: Triangle.
Position: Wave ((C)).
Direction next higher degrees: wave IV.
Wave cancel invalid level: 56581.
Details: Movement within the Triangle pattern.
Bitcoin/ U.S. dollar (BTCUSD)Trading Strategy: Movement within the Triangle pattern of the fourth wave before increasing again in the fifth wave. We are still missing two more moves to complete the pattern, so wait for the correction to complete to rejoin the trend.
Bitcoin/ U.S. dollar(BTCUSD)Technical Indicators: The price is below the MA200 indicating a downtrend, The Wave Oscillator is a Bearish Momentum.
Bitcoin Elliott Wave technical analysis [Video]
Author

Peter Mathers
TradingLounge
Peter Mathers started actively trading in 1982. He began his career at Hoei and Shoin, a Japanese futures trading company.


