Bitcoin Elliott Wave technical analysis [Video]
![Bitcoin Elliott Wave technical analysis [Video]](https://editorial.fxstreet.com/images/Markets/Currencies/Digital Currencies/Bitcoin/bitcoins-33646574.jpg)
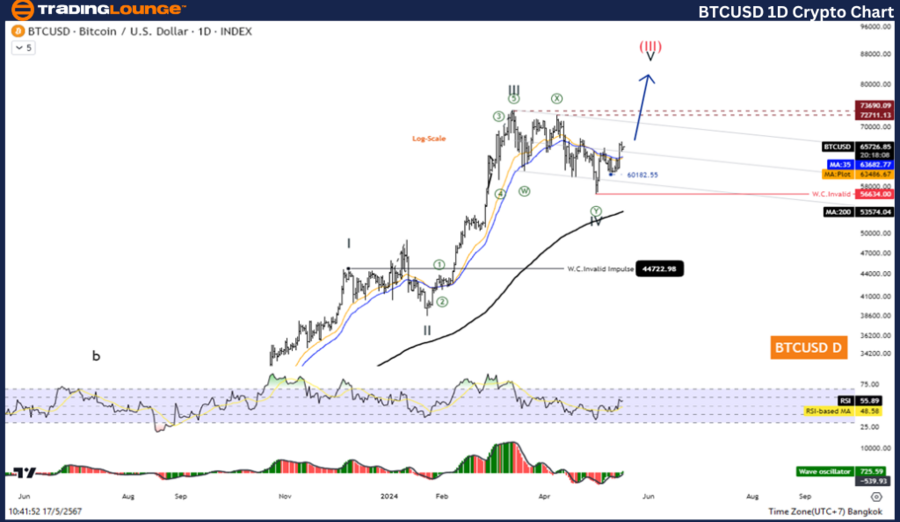
Elliott Wave Analysis TradingLounge Daily Chart,
Bitcoin/ U.S. dollar(BTCUSD).
BTC/USD Elliott Wave technical analysis
Function: Counter Trend.
Mode: Corrective.
Structure: Flat.
Position: Wave ((C)).
Direction next higher degrees: Wave (III).
Wave cancel invalid level: 31046.25.
Details: Wave IV may be complete and the Price increase again in Wave V.
Bitcoin/U.S. dollar(BTCUSD)Trading Strategy:
Overall, Bitcoin is still in an uptrend. But it is a period of correction in the fourth wave. which appears to be complete. Therefore, it is an opportunity for us to join the trend once again. Look for opportunities to open long positions.
Bitcoin/U.S. dollar(BTCUSD)Technical Indicators: The price is above the MA200 indicating an Uptrend, The Wave Oscillator is a Bullish Momentum.
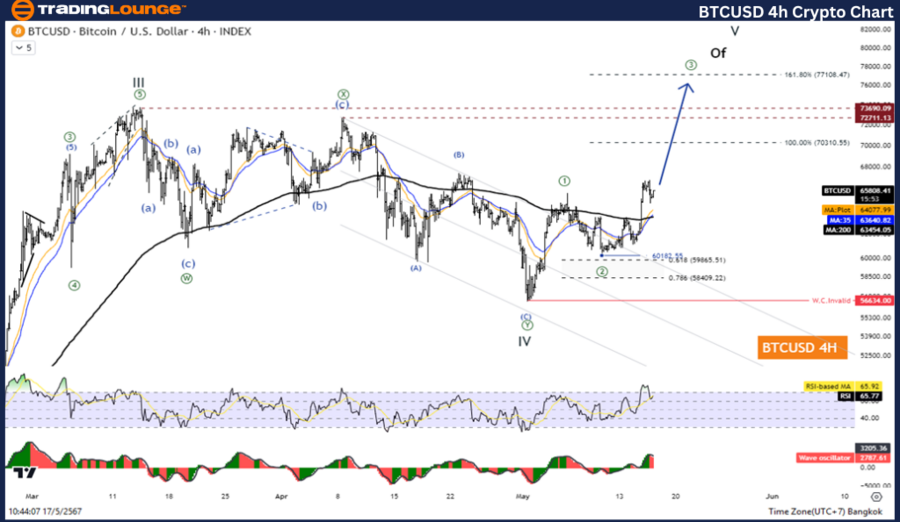
Elliott Wave Analysis TradingLounge H4 Chart,
Bitcoin/ U.S. dollar(BTCUSD)
BTC/USD Elliott Wave technical analysis
Function: Counter Trend.
Mode: Corrective.
Structure: Flat.
Position: Wave C.
Direction next higher degrees: Wave (2).
Wave cancel invalid level: 59835.83.
Details: Wave (2) is equal to 61.8% of Wave (1) at 61903.07.
Bitcoin/U.S. dollar(BTCUSD)Trading Strategy:
Overall, Bitcoin is still in an uptrend. But it is a period of correction in the fourth wave. which appears to be complete. Therefore, it is an opportunity for us to join the trend once again. Look for opportunities to open long positions..
Bitcoin/U.S. dollar(BTCUSD)Technical Indicators: The price is above the MA200 indicating an Uptrend, The Wave Oscillator is a Bullish Momentum.
Technical analyst: Kittiampon Somboonsod
BTC/USD Elliott Wave technical analysis [Video]
Author

Peter Mathers
TradingLounge
Peter Mathers started actively trading in 1982. He began his career at Hoei and Shoin, a Japanese futures trading company.


