|

Bitcoin Cash technical analysis: BCH/USD bullish flag subject to a potential breakout

  • Bitcoin Cash on Tuesday late in the session is trading in minor negative, nursing losses of just 0.10%.
  • BCH/USD price action breached a near-term ascending trend line, but buyers protect $400 mark. 
  • The daily chart view can see the price moving within a bullish flag structure. 

Spot rate:                 417.69

Relative change:      -0.10%

High:                        428.89

Low:                         410.61

BCH/USD

Overview
Today last price417.7201
Today Daily Change0.0061
Today Daily Change %0.00
Today daily open417.714
 
Trends
Daily SMA20431.3246
Daily SMA50420.5694
Daily SMA100357.0866
Daily SMA200248.3095
Levels
Previous Daily High420.4
Previous Daily Low406.0993
Previous Weekly High449.2051
Previous Weekly Low380.4645
Previous Monthly High516.9074
Previous Monthly Low362.9877
Daily Fibonacci 38.2%414.9371
Daily Fibonacci 61.8%411.5622
Daily Pivot Point S1409.0756
Daily Pivot Point S2400.4371
Daily Pivot Point S3394.7748
Daily Pivot Point R1423.3763
Daily Pivot Point R2429.0385
Daily Pivot Point R3437.677

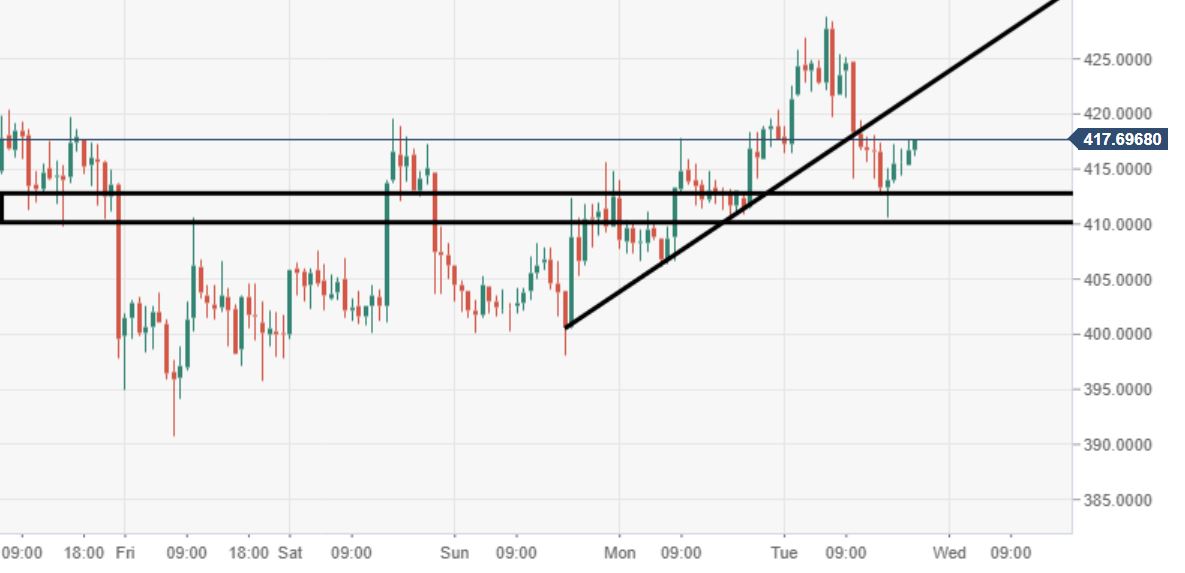
BCH/USD 60-minute chart

  • 60-minute chart view saw a breakout of a near-term ascending trend line, price caught by buyers at $400 territory.
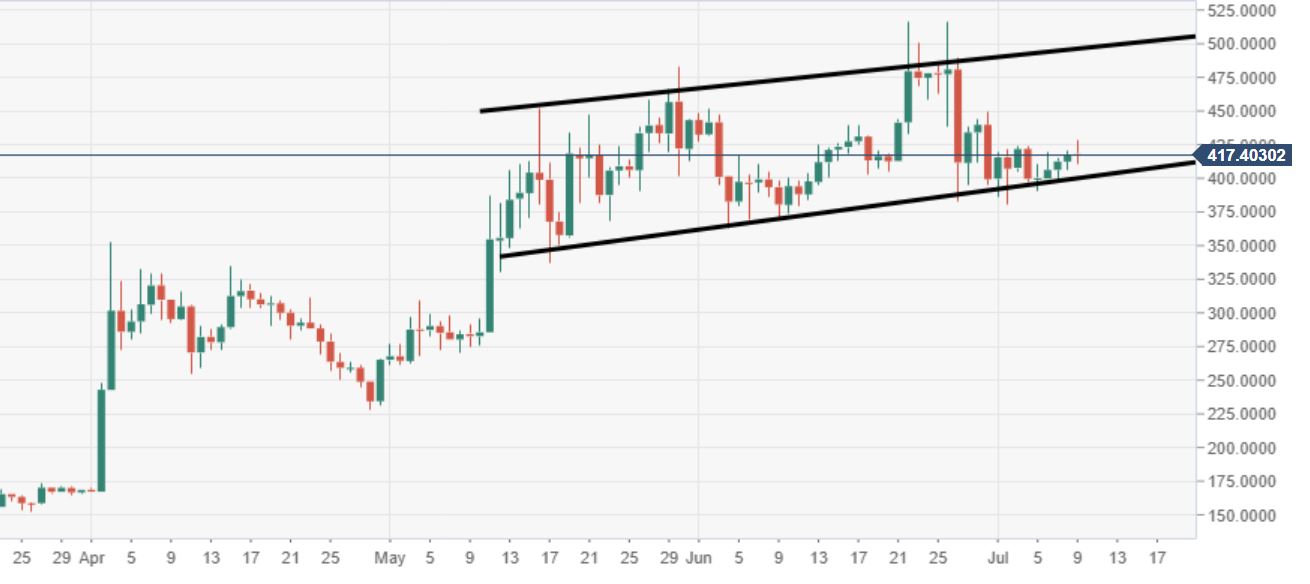
BCH/USD daily chart

  • Price action via the daily continues to move within the confinements of a bullish flag, subject to a potential breakout. 

Author

Ken Chigbo

Ken Chigbo

Independent Analyst

Ken has over 8 years exposure to the financial markets. He started his career as an analyst, covering a variety of asset classes; forex, fixed income, commodities and equities.

More from Ken Chigbo
Share:

Editor's Picks

Ripple bulls defend key support amid waning retail demand and ETF inflows

XRP ticks up above $1.40 support, but waning retail demand suggests caution. XRP attracts $4 million in spot ETF inflows on Thursday, signaling renewed institutional investor interest.

Crypto Today: Bitcoin, Ethereum, XRP rebound as risk appetite improves

Bitcoin rises marginally, nearing the immediate resistance of $68,000 at the time of writing on Friday. Major altcoins, including Ethereum and Ripple, hold key support levels as bulls aim to maintain marginal intraday gains.

Bitcoin Weekly Forecast: No recovery in sight 

Bitcoin price continues to trade sideways between $65,729 and $71,746, extending its consolidation since February 7. US-spot ETFs record an outflow of $403.90 million through Thursday, pointing to the fifth consecutive week of withdrawals.

Pi Network Price Forecast: PI recovery stalls amid profit-taking

Pi Network tests 50-day EMA support on Friday, after a 5% decline the previous day. PiScan data shows large deposits on CEXs totaling over 4 million PI tokens in the last 24 hours, reflecting an exodus of investors taking profits.

Bitcoin Price Annual Forecast: BTC holds long-term bullish structure heading into 2026

Bitcoin (BTC) is wrapping up 2025 as one of its most eventful years, defined by unprecedented institutional participation, major regulatory developments, and extreme price volatility.

Bitcoin: No recovery in sight

Bitcoin (BTC) price continues to trade within a range-bound zone, hovering around $67,000 at the time of writing on Friday, and falling slightly so far this week, with no signs of recovery.