Bitcoin Cash Price Prediction: BCH technicals turn bearish, risking freefall to $400– Confluence Detector
- Bitcoin Cash fails to break above the resistance at $540 as overhead pressure increases.
- As shown by the confluence indicator, little to no support suggests that correction to $400 is likely.

Bitcoin Cash appears to be struggling to hold at $500 in the wake of rejection from highs around $540. A glance at the 4-hour chart highlights increasing overhead pressure. If BCH closes the day under $500, significant downward pressure will come into the picture.
Bitcoin Cash uptrend sabotaged
BCH has in the past few days recovered from Monday’s drop to $400. The momentum was built within a rising wedge pattern. The correction from the weekly high at $540 is testing the lower trendline of the pattern. A break below the lower trendline could call for more sell orders as Bitcoin Cash dives toward $400.
Notably, breakdowns usually occur before the trendlines converge. The typical correction is generally confirmed by decreasing volume (highlighting a divergence between volume and price). Downward price actions are usually fast and drastic.
%20(54)-637462963644934841.png)
BCH/USD 4-hour chart
The confluence Detector validates the bearish outlook by presenting multiple resistance zones ahead of Bitcoin Cash. For instance, an initial hurdle is highlighted at $511 by the SMA five one-day.
If Bitcoin Cash breaks this zone, the uptrend could be stopped by the most robust barrier at $517. This zone is home to the one-day 38.2% Fibonacci level and the 1-hour Bollinger band middle boundary.
On the downside, little support has been provided for Bitcoin Cash, where the only formidable anchor lies at $507. This confluence zone hosts the 10 SMA 4-hour, the five SMA 1-hour, and the 15-minutes previous low.
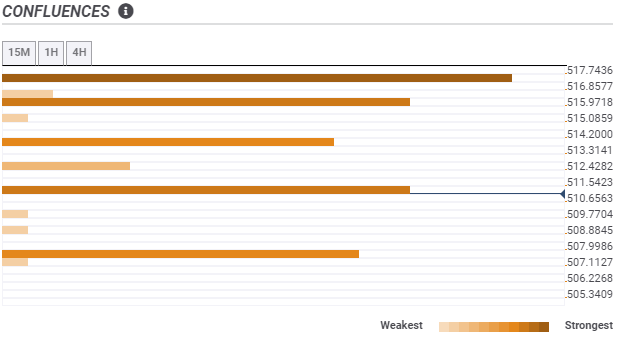
BCH/USD confluence levels
On the other hand, the 50 Simple Moving Average is in line to offer support in case the price explores the areas under $500. If the price rebounds from here, Bitcoin Cash will gain momentum, favoring another run-up to $540 and perhaps $600.
Author

John Isige
FXStreet
John Isige is a seasoned cryptocurrency journalist and markets analyst committed to delivering high-quality, actionable insights tailored to traders, investors, and crypto enthusiasts. He enjoys deep dives into emerging Web3 tren


