Bitcoin Cash price on the verge of a sell-off as indicator flashes various sell signals
- Bitcoin Cash price had a massive 40% rally from December 23 until December 28.
- The digital asset seems to be poised for a massive correction according to several indicators.

BCH had a significant rally in the past week, outperforming several coins. The digital asset now seems poised for a pullback which should be considered healthy, but imminent. Various indicators suggest it will happen soon.
Bitcoin Cash price prepares for a pullback down to $300
On the 15-minutes chart the TD Sequential indicator has just presented a sell signal, similarly, on the 30-minutes chart, the indicator is on the verge of printing the same call within the next 30 minutes.
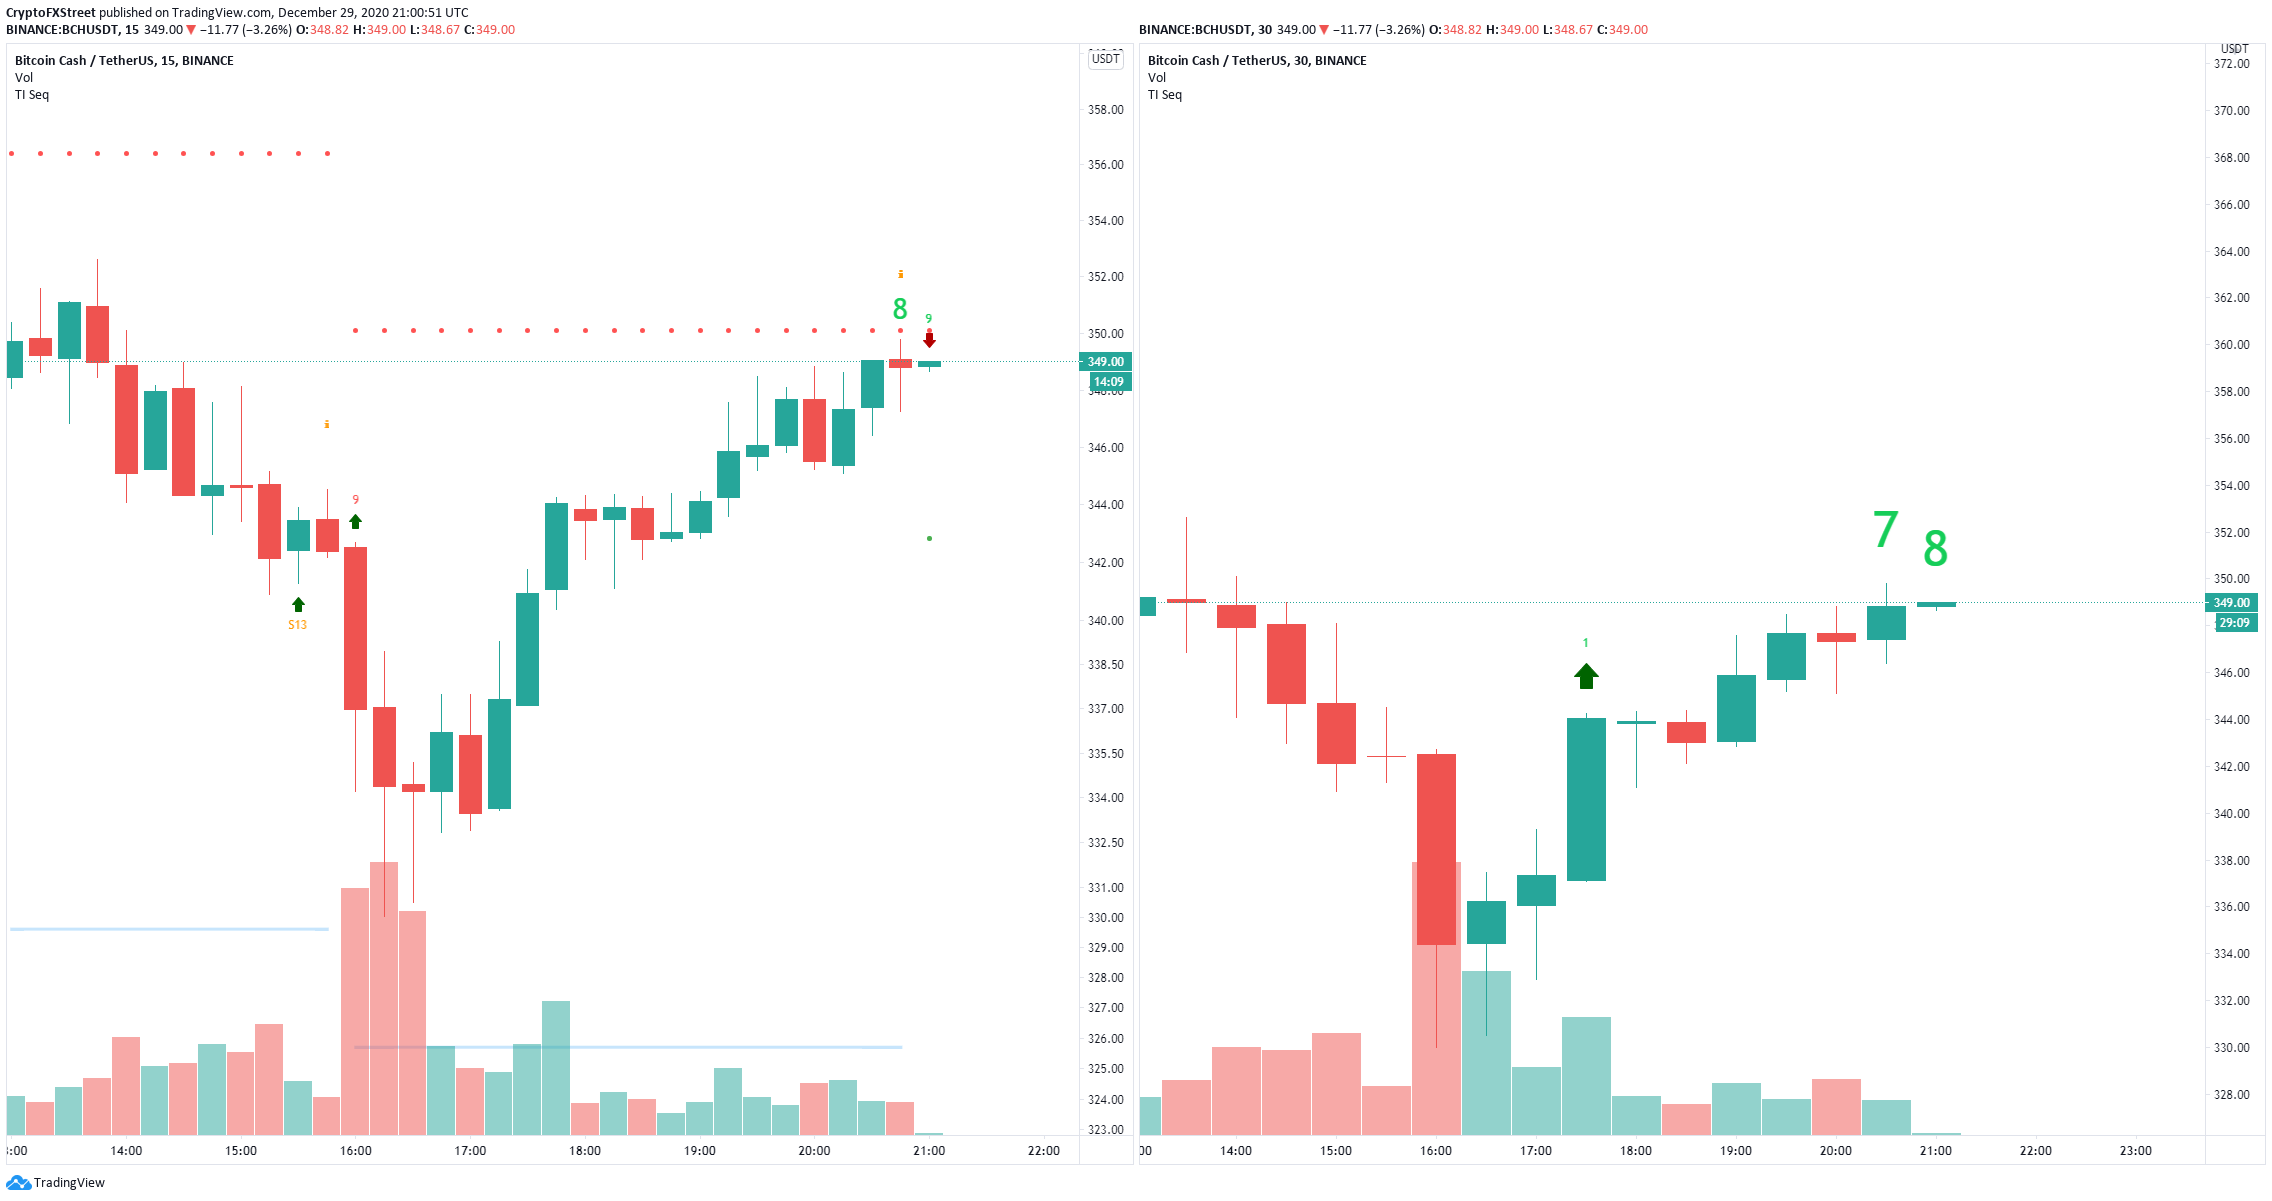
BCH/USD 15-minutes and 30-minutes charts
Furthermore, the TD Sequential indicator also presented a significant sell signal on the 12-hour chart which seems to be getting some continuation. The In/Out of the Money Around Price (IOMAP) chart shows a strong resistance level at $354.
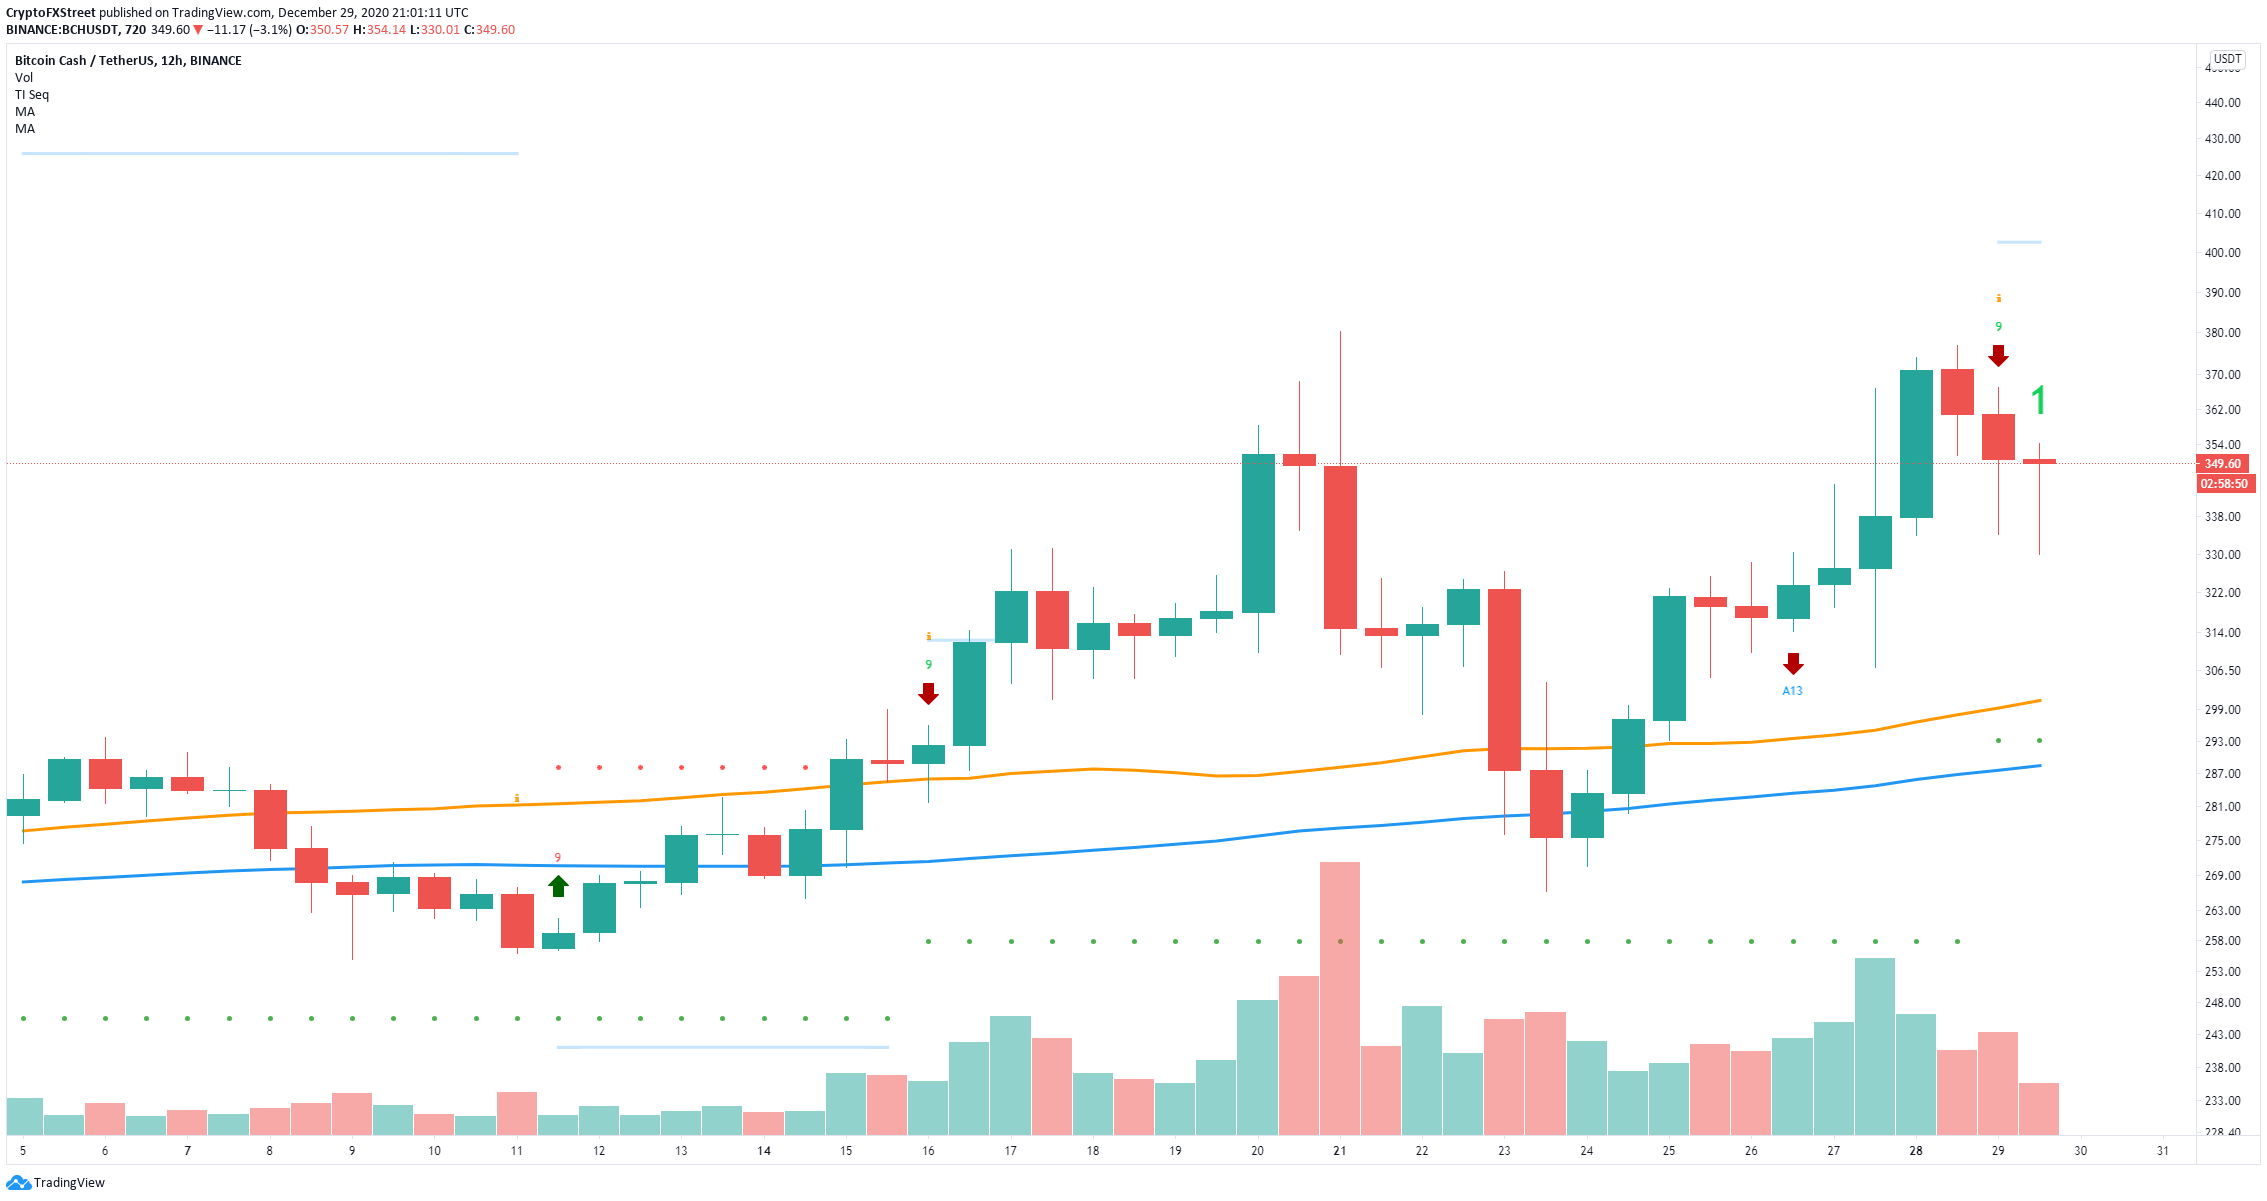
BCH/USD 12-hour chart
According to the IOMAP chart, the most critical support area is located between $325 and $335. A breakdown below this range can quickly push BCH price down to $300. Let’s take a look at the confluence detector to find out significant levels.
-637448732539628511.png)
BCH IOMAP chart
It seems that on the way down there is only one significant support area between $345 and $344 which coincides with several SMAs and the previous hourly low and the Middle Bollinger Band on the 4-hour chart.
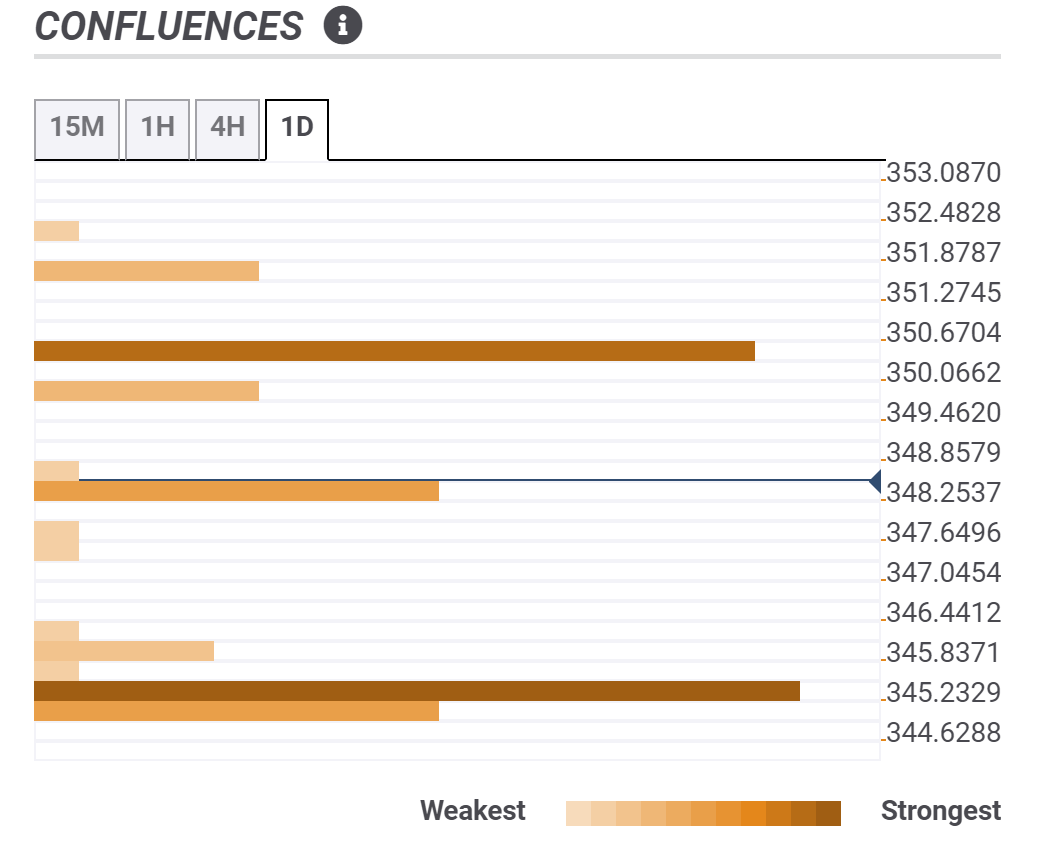
BCH Confluence Levels
When it comes to resistance above, the level at $350 seems to be the most critical point as it coincides with the previous hourly and 15-minutes highs and the Fib 61.8% level on the daily chart.
Author

Lorenzo Stroe
Independent Analyst
Lorenzo is an experienced Technical Analyst and Content Writer who has been working in the cryptocurrency industry since 2012. He also has a passion for trading.


