|

Bitcoin Cash Price Analysis: BCH/USD may have one last fall before bull run

  • Bitcoin Cash price is trading in the green, with gains of 5.50% in the second half of the session.
  • BCH/USD price action is largely capped by a range at $225-50. 
  • There appears to be a lack of general market commitment, given soft investor sentiment. 

BCH/USD weekly chart

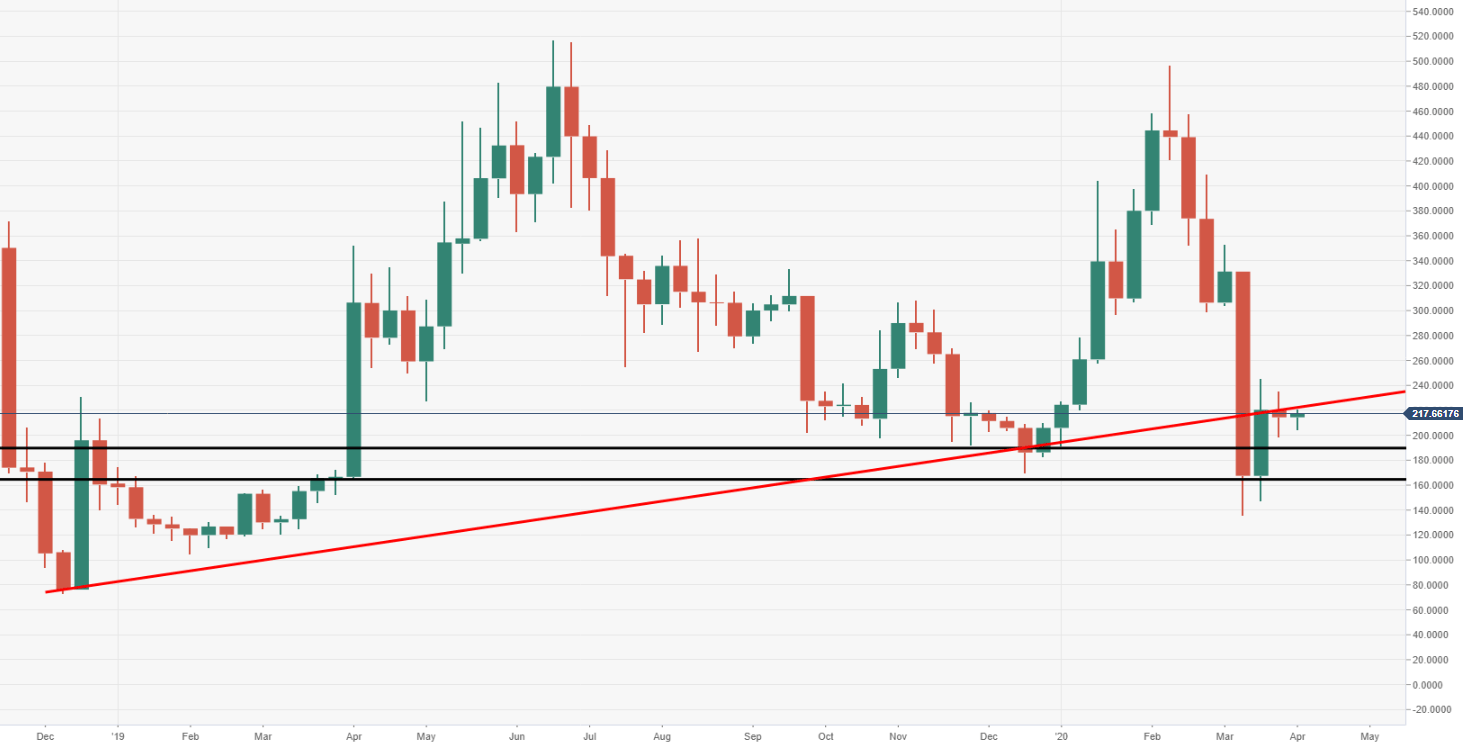
The price closed in the red for the week, as vulnerabilities stack up for another potential drop. Should the bears breakdown the psychological $200 mark, it would likely open the door to another wave of selling. 
BCH/USD daily chart

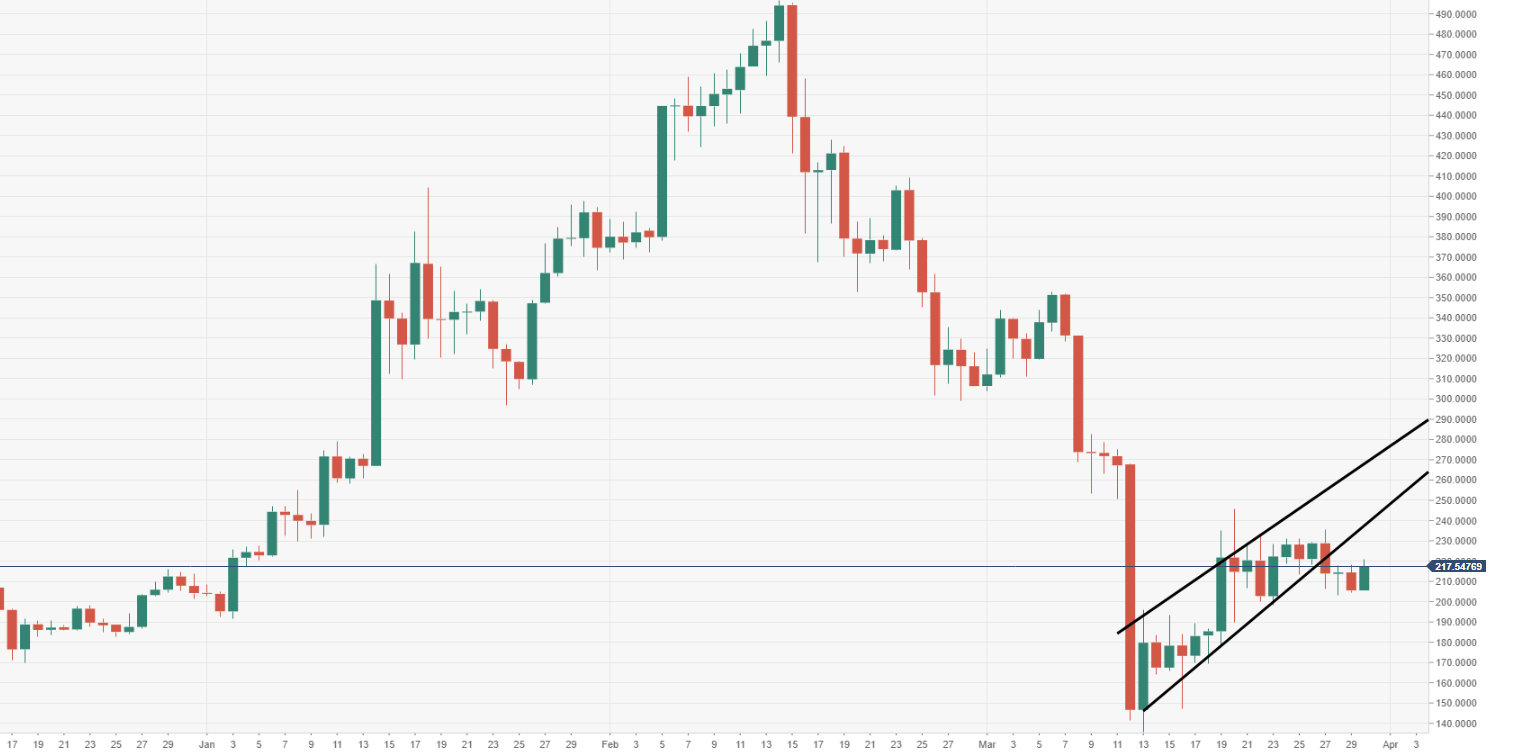
Daily conditions are extremely narrow and have offered little in terms of committed direction, this has been seen for the past ten sessions. 
Spot rate:                223.88

Relative change:    +5.50%

High:                        220.81

Low:                         205.54
 

BCH/USD

Overview
Today last price217.9037
Today Daily Change12.3331
Today Daily Change %6.00
Today daily open205.5706
 
Trends
Daily SMA20207.3303
Daily SMA50308.2762
Daily SMA100302.5929
Daily SMA200273.3407
 
Levels
Previous Daily High218.281
Previous Daily Low204.4384
Previous Weekly High235.4688
Previous Weekly Low198.4748
Previous Monthly High496.9345
Previous Monthly Low299.0373
Daily Fibonacci 38.2%209.7262
Daily Fibonacci 61.8%212.9931
Daily Pivot Point S1200.579
Daily Pivot Point S2195.5874
Daily Pivot Point S3186.7364
Daily Pivot Point R1214.4216
Daily Pivot Point R2223.2726
Daily Pivot Point R3228.2642

Author

Ken Chigbo

Ken Chigbo

Independent Analyst

Ken has over 8 years exposure to the financial markets. He started his career as an analyst, covering a variety of asset classes; forex, fixed income, commodities and equities.

More from Ken Chigbo

Share:

Editor's Picks

Pi Network extends consolidation as bulls eye $0.10

Pi Network price holds steady on Friday, maintaining a consolidating tone for three consecutive days. Mild retail strength in the PI token remains stable, with Open Interest above $9 million, while social buzz eases.

Bitcoin Weekly Forecast: Hormuz uncertainty clouds BTC outlook

Bitcoin trades around $62,900 on Friday, down over 3% so far this week, but signs of stabilization are emerging. Tensions in the Strait of Hormuz are keeping Oil prices and the war-risk premium elevated, supporting the US Dollar and weighing on BTC.

Crypto Today: Bitcoin, Ethereum, and Ripple risk steeper correction as bearish pressure mounts

Bitcoin trades below $63,000 on Friday, projecting a downside bias as selling pressure resurfaces. Ethereum and Ripple also take a bearish path, risking a drop below the 50-day Exponential Moving Average at $1,856 and the $1.00 psychological support, respectively.

Bitcoin SV Price Forecast: BSV hits three-month high, eyeing 200-day EMA breakout

Bitcoin SV (BSV) is up nearly 2% on Friday, extending a steady upward trend over the last two weeks. Retail strength builds in BSV amid multiple vulnerabilities found in the Bitcoin ecosystem.

Bitcoin: Hormuz uncertainty clouds BTC outlook
Bitcoin (BTC) trades around $62,900 at the time of writing on Friday, down over 3% so far this week amid cautious institutional demand and persistent geopolitical uncertainty. While BTC shows signs of stabilization, elevated Oil prices and tensions in the Strait of Hormuz continue to weigh on risk sentiment, keeping the Crypto King’s near-term outlook under pressure.