Bitcoin Cash lags falling wedge pattern breakout
- Falling wedge pattern breakout to test $120 as the bulls eye $130 resistance level.
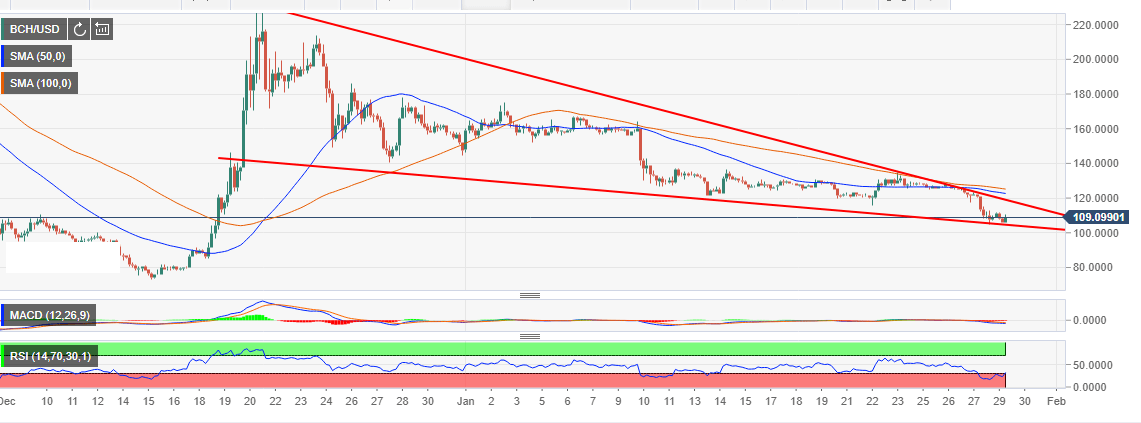
- Bitcoin Cash defends support at $108 but risks dropping towards $100.

Bitcoin Cash bears are still winning while the bulls still feel quite intimidated. The crypto suffered under the rough bear claws sliding below the key support at $120. Moreover, Bitcoin Cash continued with the downtrend below $110.
While the asset is exchanging hands at $108 at press time, the rates and charts table shows that it has corrected lower 1.93% on the day. A broader look using the 240-muntes chart show the Bitcoin Cash has been trimming gains since mid-December where it almost traded close to $220.
The price has formed a falling wedge pattern that is a breakout. Meanwhile, BCH is making a bullish move above the current short-term support at $108.00. A break above $110 could lead to further movement upwards towards $120. Both the 50-day Simple Moving Average (SMA) and the 100-day SMA will limit gains above $120 but below $130.
BCH/USD 4-hour chart
Author

John Isige
FXStreet
John Isige is a seasoned cryptocurrency journalist and markets analyst committed to delivering high-quality, actionable insights tailored to traders, investors, and crypto enthusiasts. He enjoys deep dives into emerging Web3 tren


