Bitcoin Cash (BCH) price analysis: A break above the 50-day SMA imminent
- Bitcoin Cash buyers increase their influence with eyes set on $120 in the short-term.
- A break above the rising channel resistance could pave the way more growth towards $130.

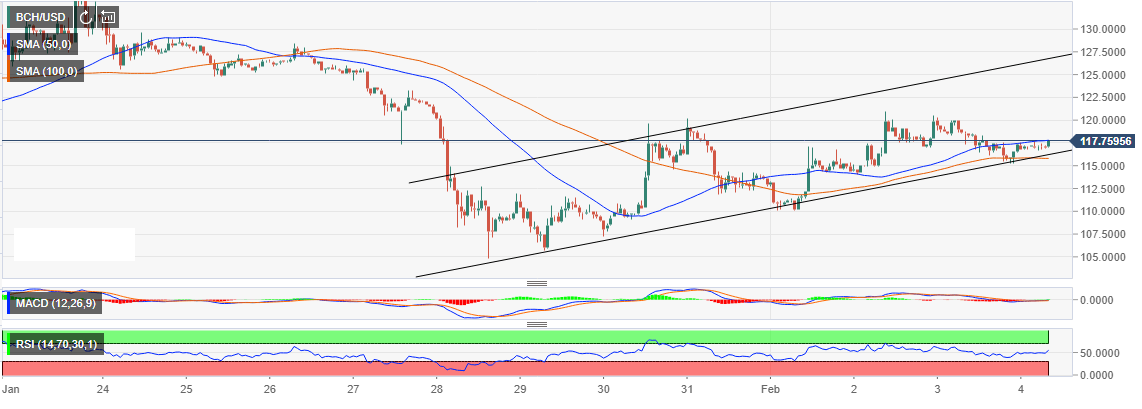
Following the declines last week where Bitcoin Cash buyers defended the primary support at $105, the bulls appear to be back and are pushing for correction. The asset has been trending upwards from the primary support to the current $117.24. At press time, Bitcoin Cash is trading between the hourly 50-day Simple Moving Average (SMA) and the 100-day SMA.
A bullish trend is forming above the 100-SMA and it is likely that we could see Bitcoin Cash recoil above $120. There has been a sharp change in the direction of the Relative Strength Index (RSI). The indicator is pointing sharply upwards above the 50% mark. This shows that the bulls are increasing their entries.
A broader look at Bitcoin Cash chart, the digital asset is also trading in an ascending channel. The channel support is vital, however, a breakout above the channel resistance will see Bitcoin Cash embark on an upward journey above $130; a move that will bring other hurdles at $140 and $160 in sight. Another support is observed at $110, above the main support at $105.
BCH/USD 1-hour chart
Author

John Isige
FXStreet
John Isige is a seasoned cryptocurrency journalist and markets analyst committed to delivering high-quality, actionable insights tailored to traders, investors, and crypto enthusiasts. He enjoys deep dives into emerging Web3 tren


