|

Bitcoin (BTC/USD) buying the dips at the blue box area

In this article we’re going to take a quick look at the Elliott Wave charts of Bitcoin BTC/USD.  BTC/USD is showing impulsive bullish sequences in the cycle from the 24955.26 low that were calling for a further strength. Recently we got a pull back that has ended at the Blue Box zone, our buying area.  In the further text we are going to explain the Elliott Wave Forecast and trading setup.

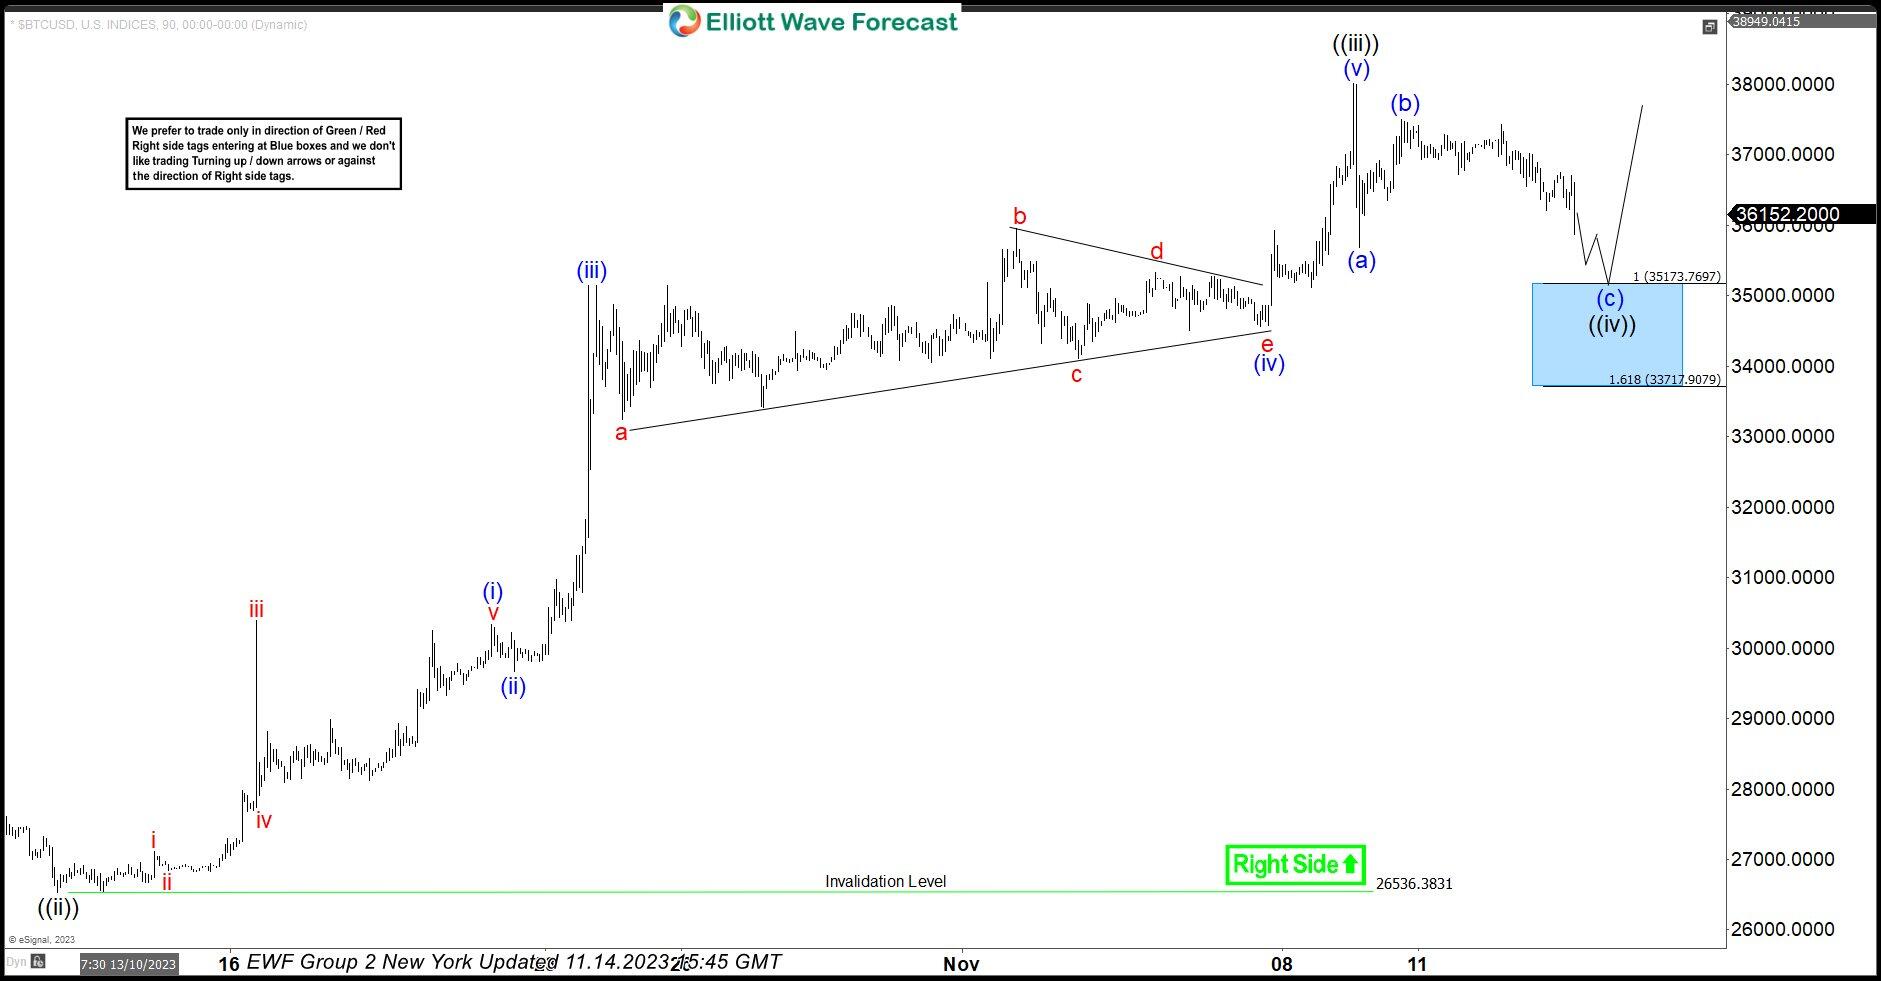
BTC/USD Elliott Wave 1 hour chart 11.04.2023

BTC/USD is giving us correction that is unfolding as a Zig Zag pattern. At the moment structure is still incomplete. Bitcoin can see more downside toward 35173.76-33717.907  blue box ( buying zone). We don’t recommend selling Bitcoin and prefer the long side. From the marked zone, BTC/USD should ideally make either rally toward new highs or in 3 waves bounce alternatively.  Once bounce reaches 50 Fibs against the (b) blue  high 37547, we will make long position risk free ( put SL at BE) and take partial profits.

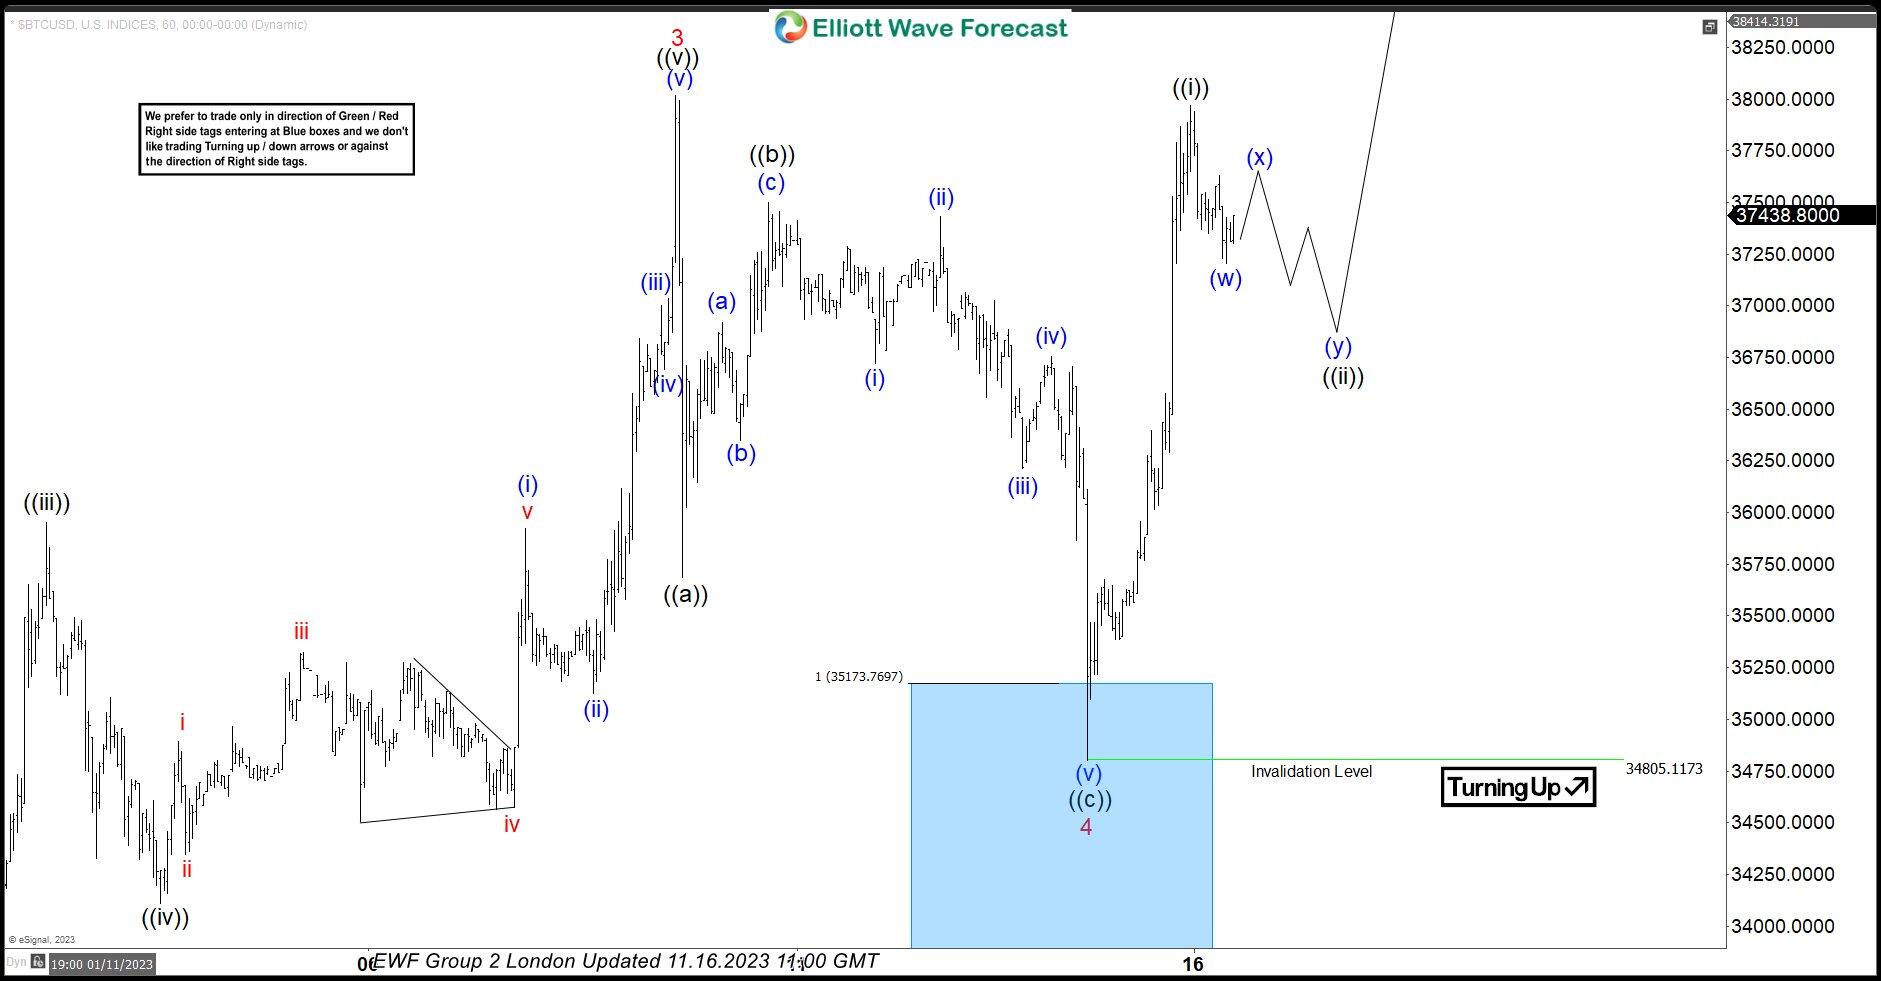
Bitcoin (BTC/USD) Elliott Wave 1 hour chart 4.14.2023

BTC/USD made extension toward our buying zone: 35173.76-33717.907. Bitcoin found buyers at the blue box as expected and we got good reaction from there, 5 waves impulsive rally that retested previous peak. Currently doing short term pull back against the 34805.11 low that can see approximately 36506-35663 area. As far as the pivot at 34805.11 low holds, we can see further rally once short term pull back completes.

Author

Elliott Wave Forecast Team

Elliott Wave Forecast Team

ElliottWave-Forecast.com

More from Elliott Wave Forecast Team
Share:

Editor's Picks

XRP trades under pressure amid weak retail demand

XRP presses down on the 50-day EMA support as risk-averse sentiment spreads despite a positive start to 2026. XRP faces declining retail demand, as reflected in futures Open Interest, which has fallen to $4.15 billion.

Pi Network Price Forecast: PI holds key support as momentum coils

Pi Network (PI) trades close to $0.2100 at press time on Friday, stabilizing after a two-day decline of nearly 2%. The PI token's trading volume steadily declines, while a surge in social dominance suggests a potential spike in retail interest.

Crypto Today: Bitcoin, Ethereum, XRP risk further decline as market fear persists amid slowing demand

Bitcoin holds $90,000 but stays below the 50-day EMA as institutional demand wanes. Ethereum steadies above $3,000 but remains structurally weak due to ETF outflows. XRP ETFs resume inflows, but the price struggles to gain ground above key support.

Bitcoin Weekly Forecast: Early-2026 rally falters as BTC investors await key catalyst

Bitcoin is trading lower toward $90,000 on Friday after encountering rejection at a key resistance zone. The price pullback in BTC is supported by fading institutional demand, as spot Exchange Traded Funds have recorded net outflows so far this week. 

Orange Juice Newsletter – Smart insights by real people. Every day.

A free newsletter highlighting key market trends to help traders stay a step ahead. Daily insights on the most relevant trading topics, compiled by our experts in an easy-to-read format so you never miss an important move.

Bitcoin: Fed delivers, yet fails to impress BTC traders

Bitcoin (BTC) continues de trade within the recent consolidation phase, hovering around $92,000 at the time of writing on Friday, as investors digest the Federal Reserve’s (Fed) cautious December rate cut and its implications for risk assets.