Bitcoin Bounces over $8K Altcoins follows

After a previously failed bounce made on Saturday, Bitcoin (+4.15) produced a strong upward movement yesterday, which drove its price to $8247. This movement was formed on increasing volume. The rest of the sector was also set in buy move with some sharp moves such as the case of Bitcoin Cash (+6.09), Bitcoin SV(+6.29), and ATOM (+5.35%). ETH (+1.92%), LTC(+2.06%), and Ripple (+1%) reacted moderately. On the token side, the best performers were CJZ (+19.4%) Link (+10%), and CENNZ (+9.5%).
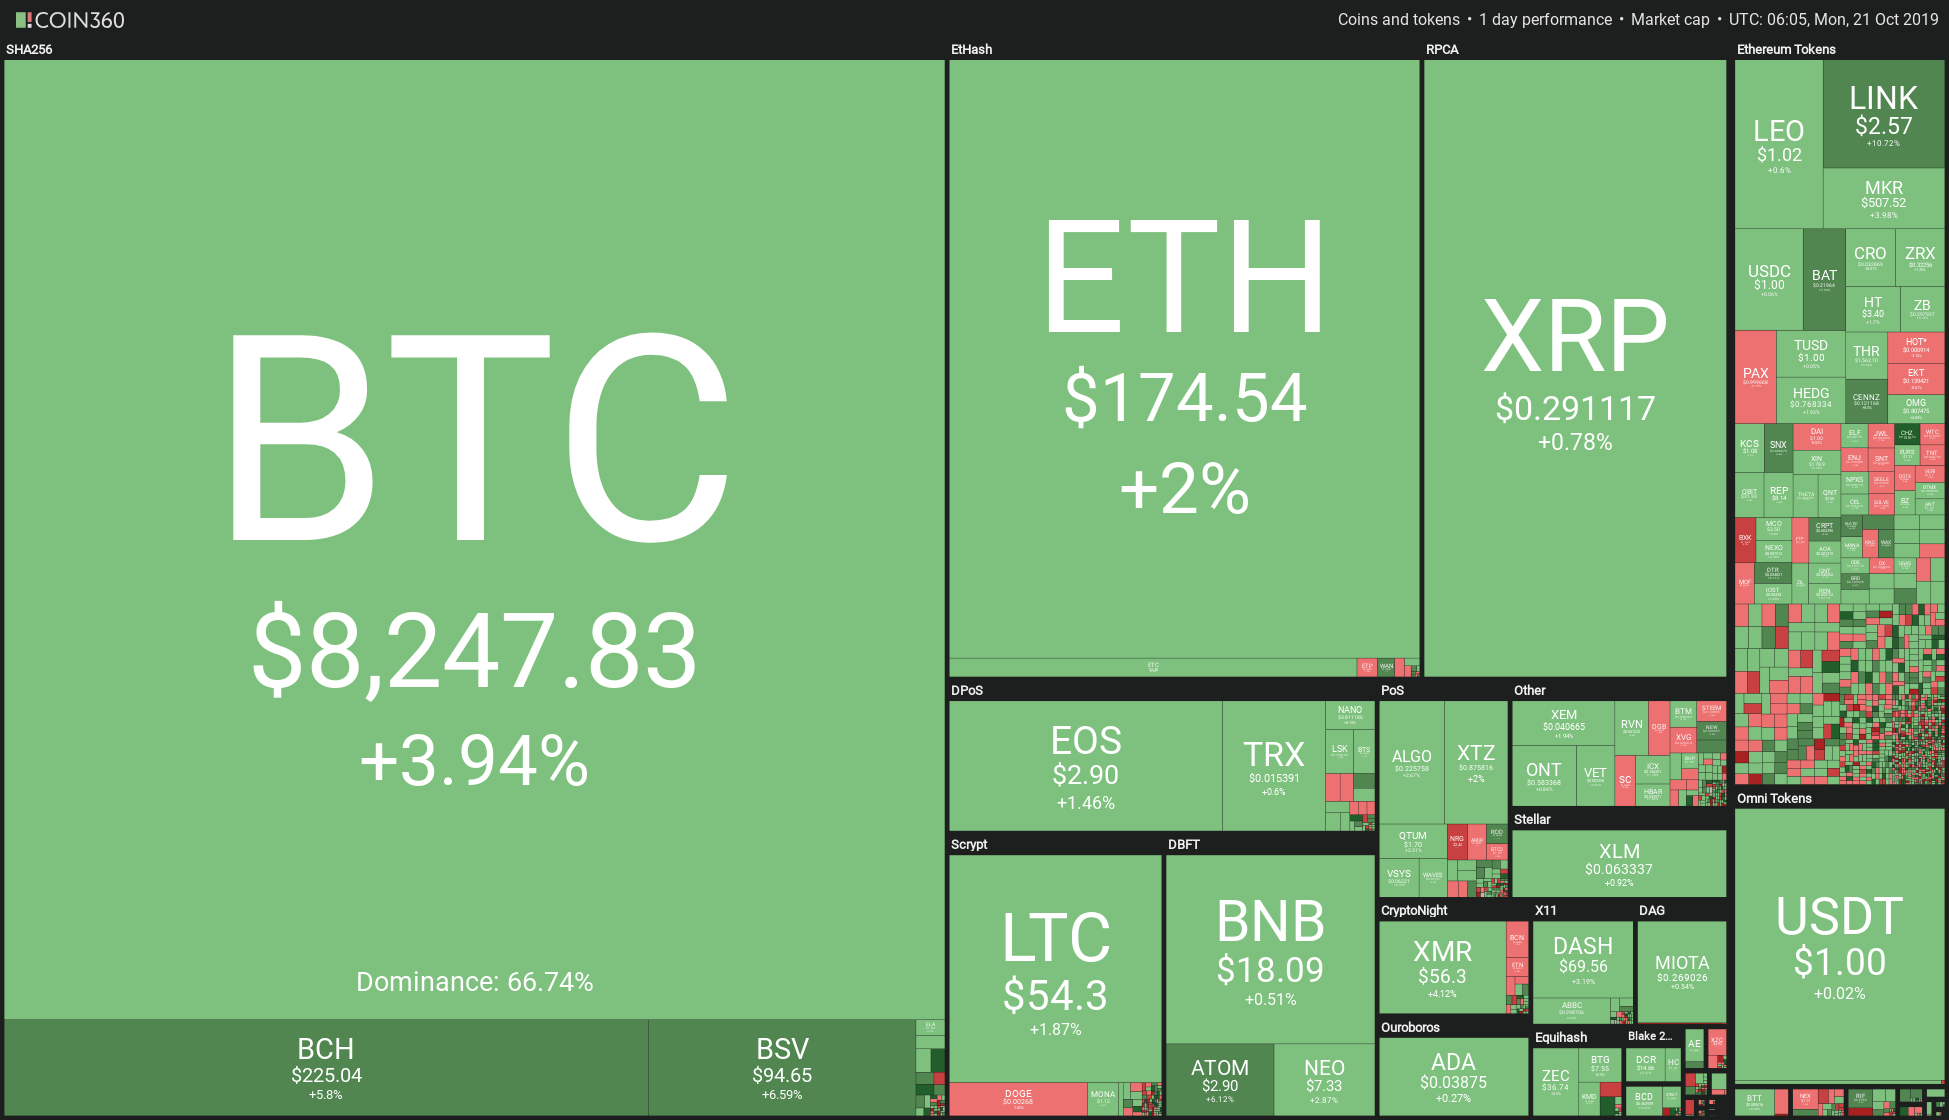
Fig 1 - 24-hour Cryptocurrency Heat map
The market capitalization moved up 3.03% to $222.655 billion, while the 24H traded volume increased 11%, to $23.615 billion. Also, Bitcoin dominance grew to 68.46%.
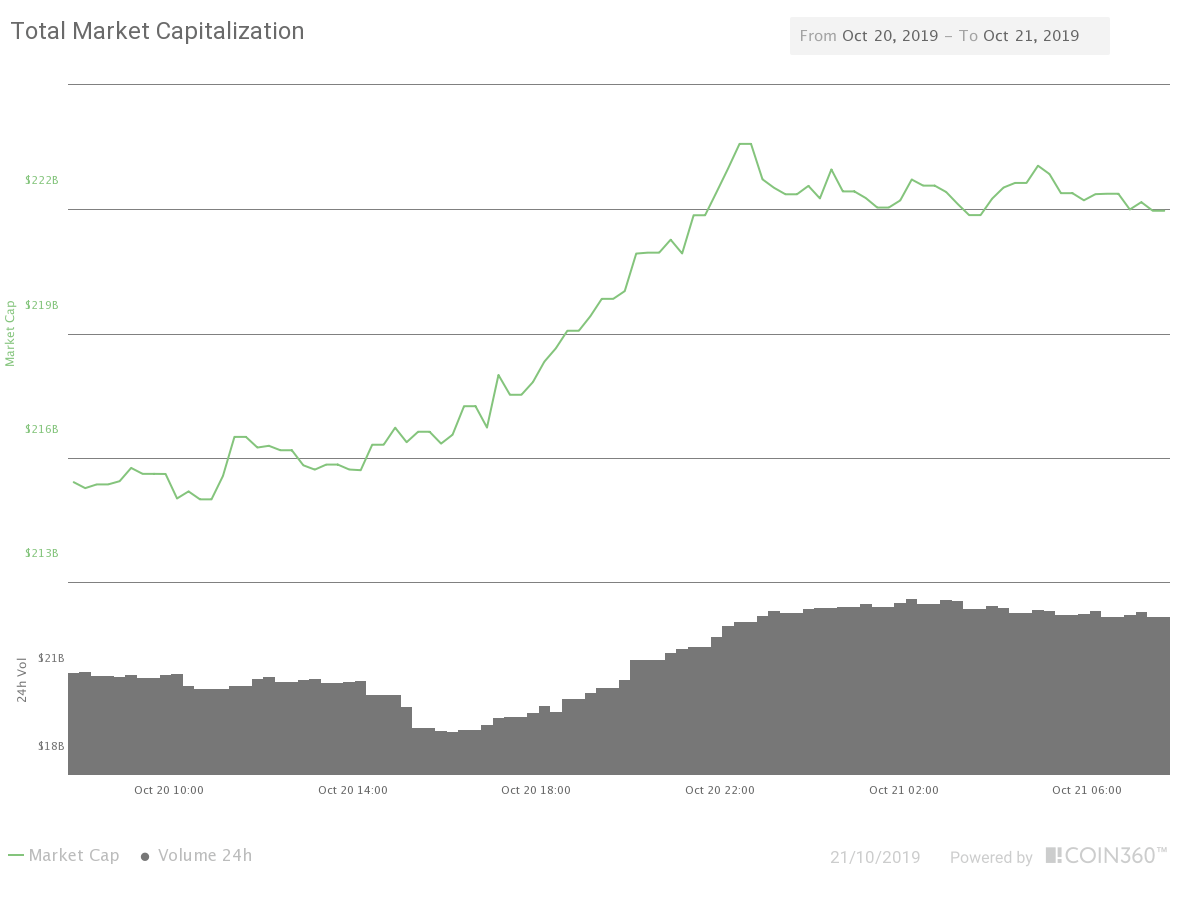
Fig 2 - 24H Crypto Market Capitalization Chart
Hot News
David Marcus told that, instead of a single Libra coin, they are open to a series of stablecoins. "...we could have a series of stablecoins, a dollar stablecoin, a euro stablecoin, a sterling pound stable coin, etc," said Marcus at a banking seminar. He also noted that the primary goal of the Libra Association is to create more efficient payment systems.
Bitcoin ·18 millionth was mined on Saturday, and it took 3935 days for this event to happen. It is a widely known fact that Bitcoin's size is limited to 21 million units. Therefore, to date, there are less than 3 million left to mine.
Technical Analysis
Bitcoin
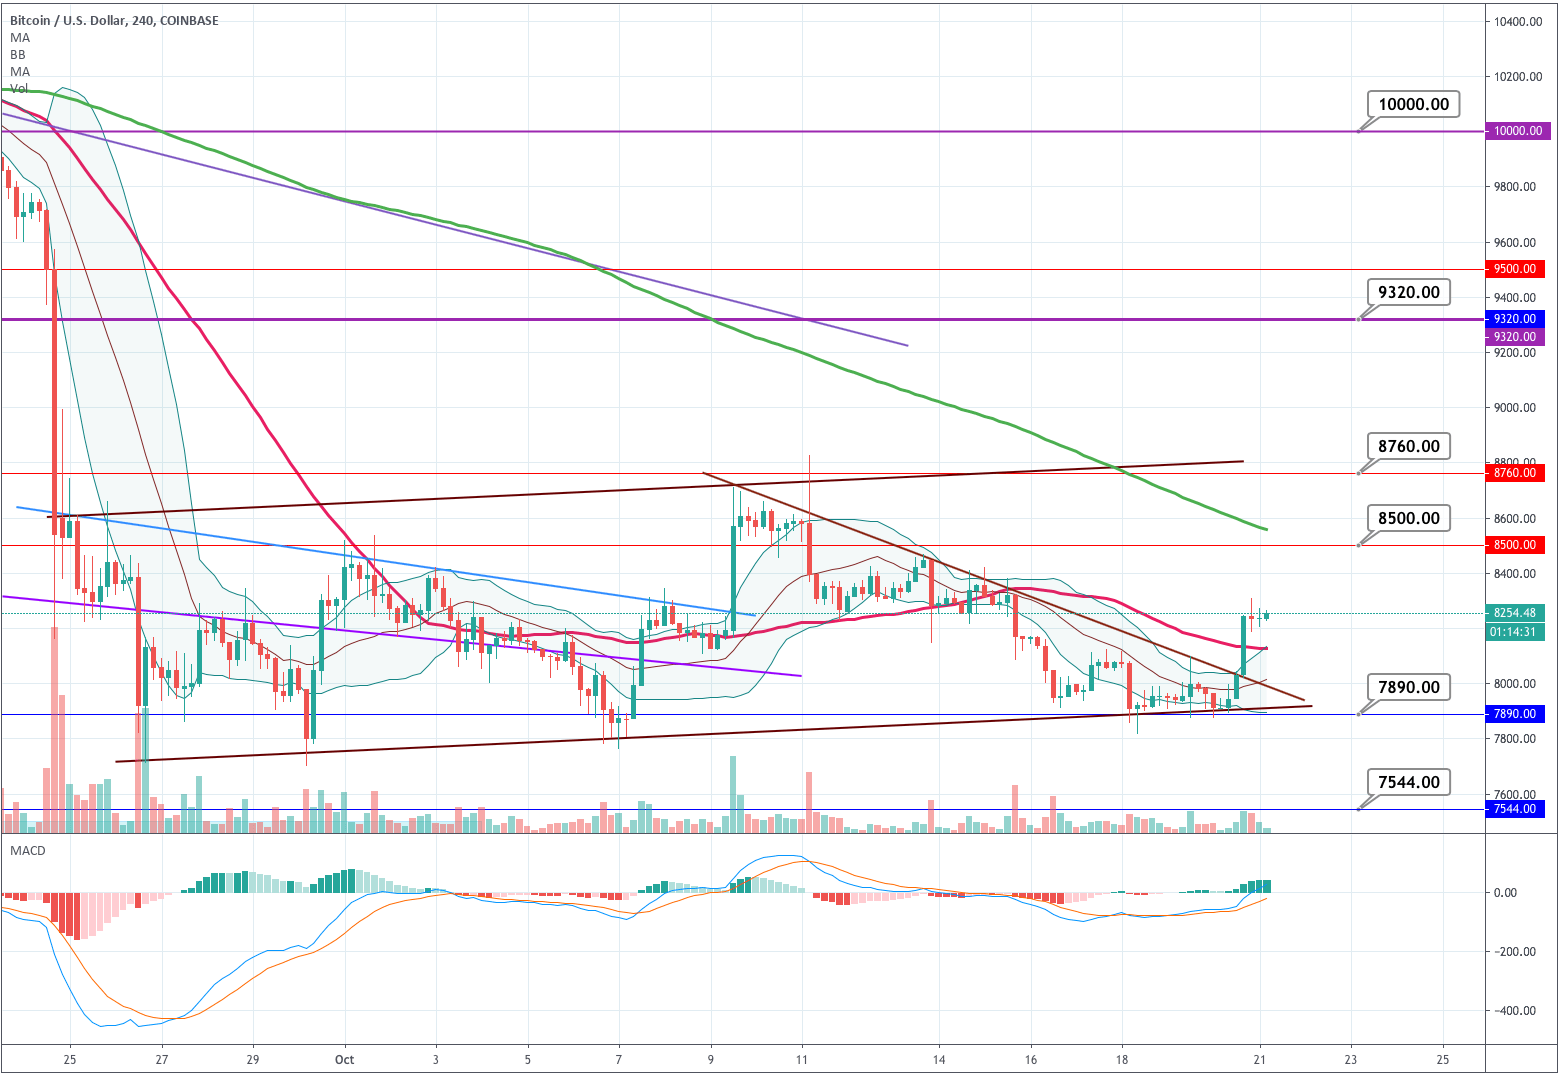
Bitcoin has broken the descending trendline after a first attempt made last Saturday and several bounces from the $7,900 level. The movement stopped just at the $8,300 level. Bitcoin seems to be moving inside a large and slightly ascending channel.
The 4H chart shows that, currently, BTC is moving in a resistance area between the levels of $8,300 and $8,400. We can see also that the price moves far away from the +1SD Bollinger line, which is a clear indication of overbought levels. For the coming hours, it is expected the price to continue its consolidation.
Critical levels to observe
| Supports | Pivot | Resistances |
| S1 $7,890 | $8,158 | R1: $8,500 |
| S2 $7,544 | R2: $8,760 | |
| S3 $7,280 | R3: $9,100 |
Ethereum
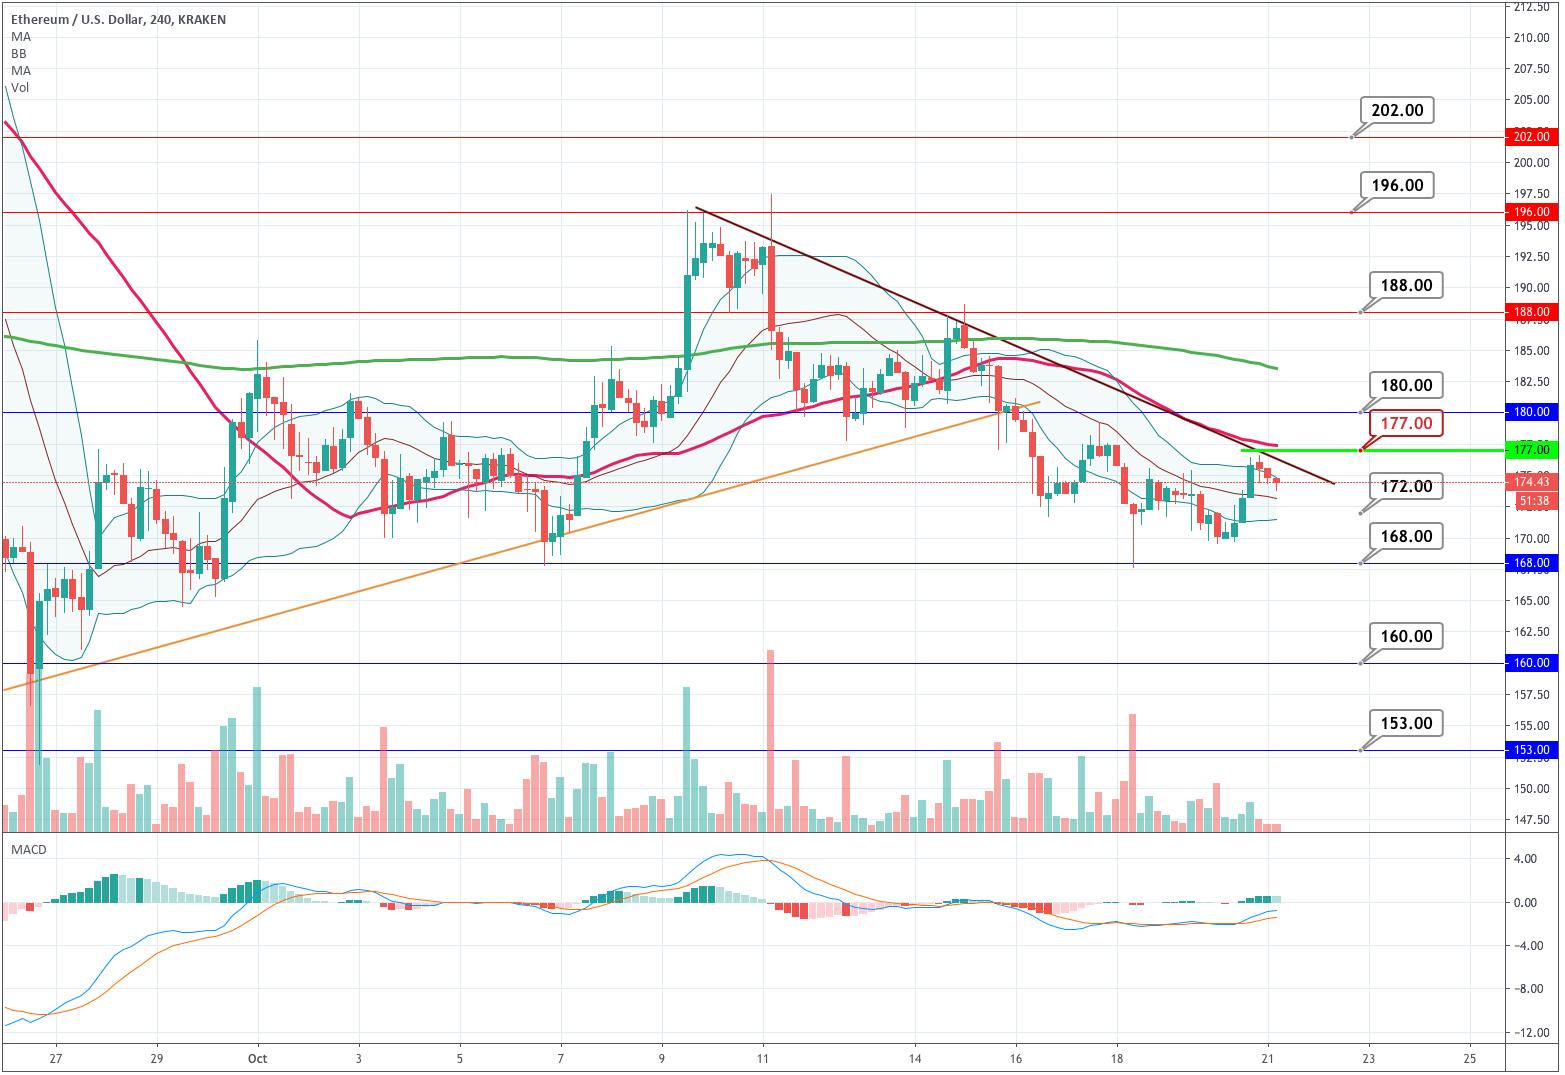
Ethereum buyers also followed the bounce of the bitcoin, bit with less enthusiasm. Te price stopped climbing near the descending trendline and is failing to make a higher high. MACD is in positive territory, and the price moves on the upper side of the Bollinger bands, but the bands still are descending. Therefore, we need to observe the price in the coming hours. The level to break for a confirmation of the upward movement is $177.
| Supports | Pivot | Resistances |
| S1 $168 | $177 | R1: $188 |
| S2 $160 | R2: $196 | |
| S3 $153 | R3: $208 |
Ripple
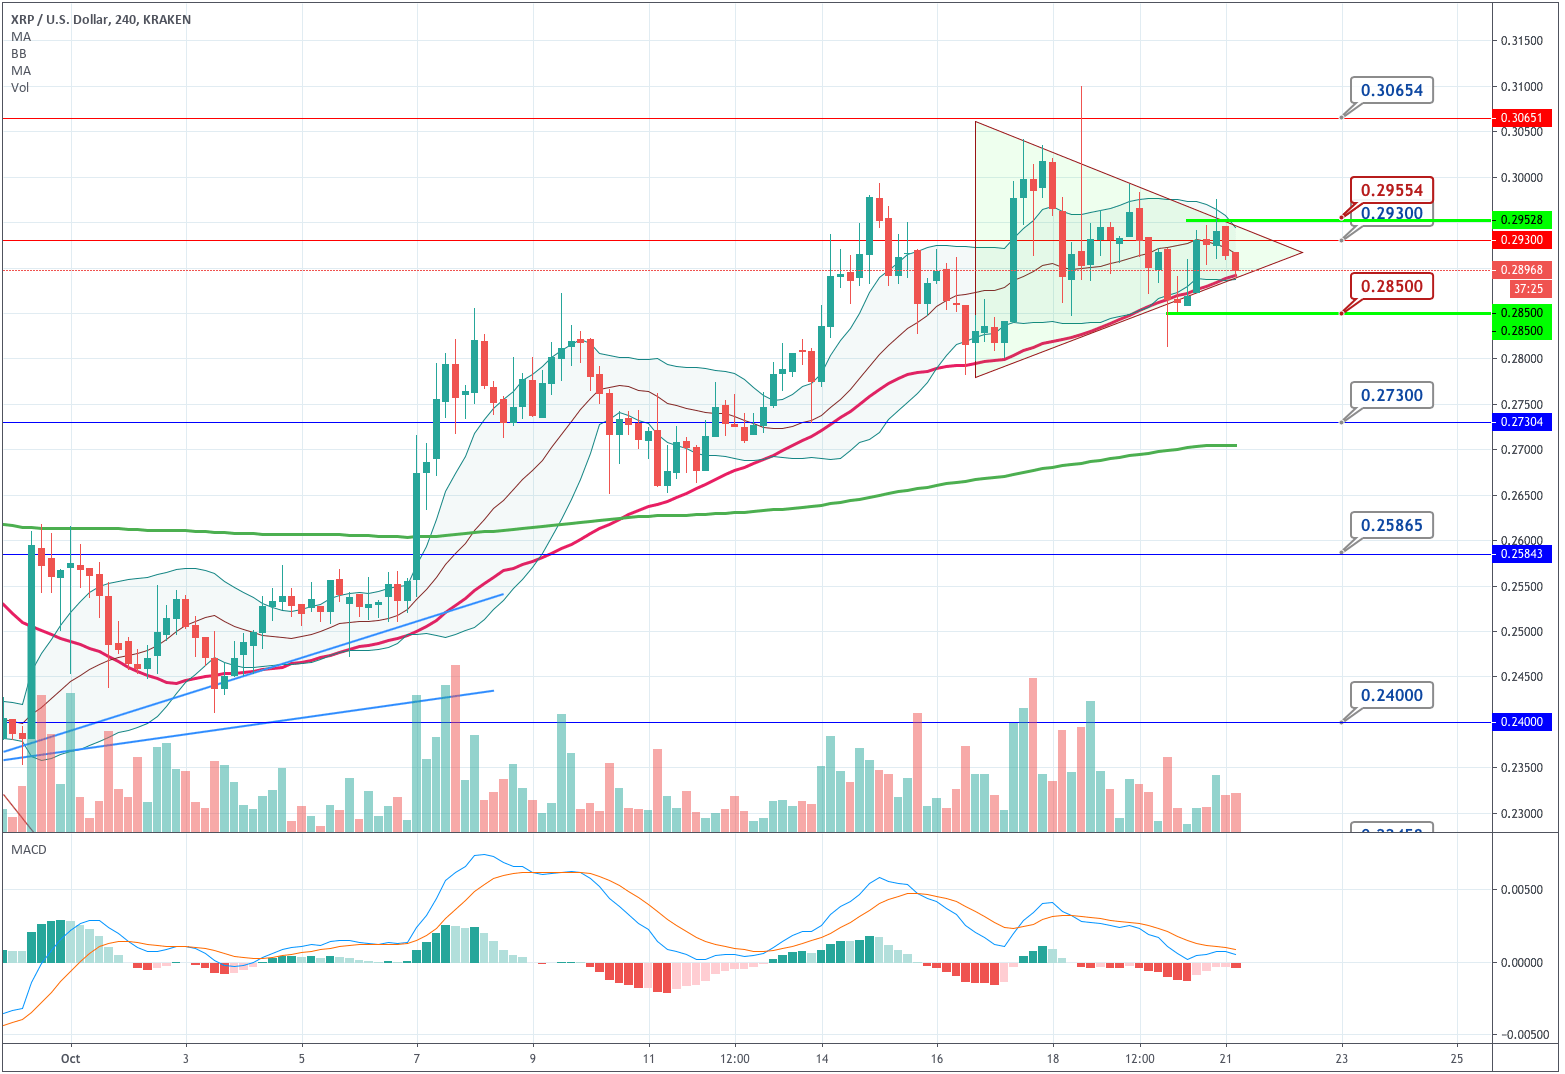
Ripple is moving inside a triangular pattern. The price moved up yesterday following the impulse of the rest of the sector, but the last six hours have retraced the major part of that move. Nonetheless, the price is still moving following, and above, its 50-period MA. The price moves below the -1SD Bollinger line and the MACD is bearish. That tells XRP moves currently in a corrective wave. The main level to break for a continuation to the upside is $0.2955, while to the downside is 0.285.
| Supports | Pivot | Resistances |
| S1 $0.273 | $0.295 | R1: $0.3 |
| S2 $0.2585 | R2: $0.325 | |
| S3 $0.24 | R3: $0.345 |
Author

EagleFX Team
EagleFX
EagleFX Team is an international group of market analysts with skills in fundamental and technical analysis, applying several methods to assess the state and likelihood of price movements on Forex, Commodities, Indices, Metals and


