Bitcoin and Ethereum technicals strengthen amid cooling inflation

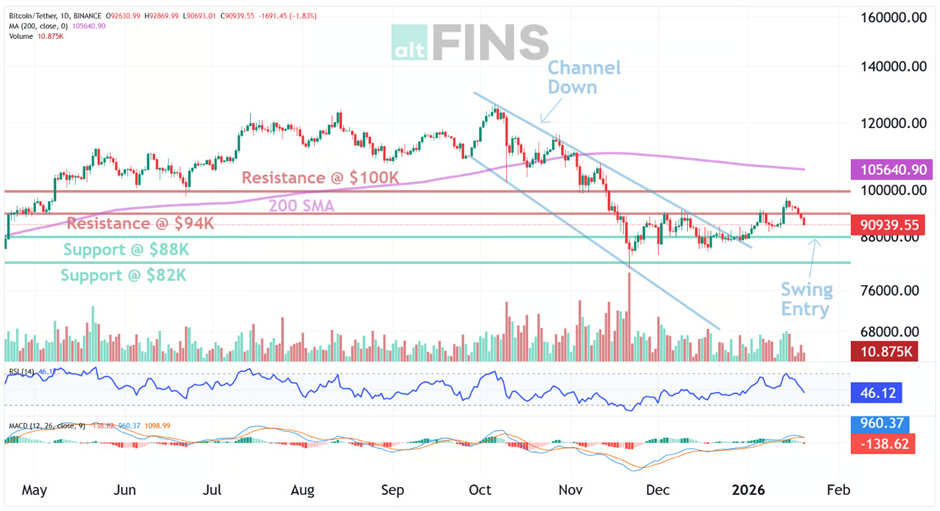
Bitcoin (BTC) – Technical analysis chart
Source: altfins.com
Bitcoin technical setup
Bitcoin’s price structure has turned bullish after breaking out above a long-term descending channel earlier this month. The breakout around the mid-$90,000s triggered a short squeeze and renewed momentum, with traders now eyeing the psychological $100,000 level as the next major resistance. Price is now approaching support, which is a level where it could pause or reverse its recent decline, at least temporarily. Support is often a level where price has bounced up in the past, or potentially prior resistance level that was broken.
This zone aligns with a heavy supply area, and technical models show a key barrier around $100K–$103K - breaching it could open the door to a larger rally (with targets up to ~$115K), while failure to clear this hurdle may prompt a pullback toward the mid-$90Ks. Nearest Support Zone is $88K, then $82K.
In terms of momentum indicators, BTC price is neither overbought nor oversold currently, based on RSI-14 levels (RSI > 30 and RSI < 70). The MACD is in bullish territory with a positive histogram and a crossover above zero, signaling robust upward momentum.
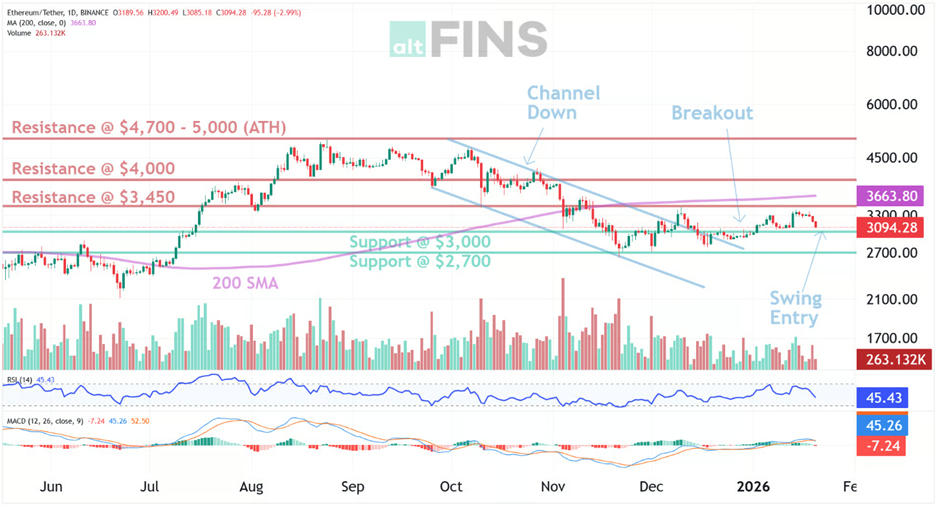
Ethereum (ETH) – Technical analysis chart
Source: altfins.com
Ethereum Technical Setup
Ethereum has similarly broken above its downward channel, confirming a trend reversal. It rallied into significant overhead resistance near ~$3,450 – a level reinforced by multi-timeframe technical confluences – and was met with initial rejection.
On the downside, the $3,000 area has proven to be a firm support and a logical swing entry zone for bulls - ETH rebounded off that region, and I see accumulation in the $3,000 – $3,050 range with risk managed below ~$2,900.
Currently, ETH’s momentum indicators show bullish but not extreme readings: the RSI sits in the mid-50s, neither overbought nor oversold, and the MACD line has crossed above its signal with a growing positive histogram – a sign of building upside momentum without significant exhaustion.
Macroeconomic Context (Jan 2026)
The macro backdrop provides important context for these crypto moves. The latest U.S. inflation data (December 2025) showed CPI up 0.3% month-over-month and 2.7% year-over-year, roughly unchanged from the prior reading.
In other words, price pressures have stabilized rather than reaccelerating, indicating that inflation is easing off its peak but remains slightly above the Federal Reserve’s 2% target.
The U.S. labor market, meanwhile, is showing signs of softening: December non-farm payrolls added only 50,000 jobs – the slowest monthly gain in five years – and the unemployment rate stands at 4.4% (up from sub-4% levels a year ago).
With inflation moderating and employment cooling, the Fed has adopted a cautious stance. The benchmark interest rate is currently in the 3.50% – 3.75% range after a series of late-2025 rate cuts, and officials are expected to hold rates steady at the upcoming January FOMC meeting.
Futures markets are beginning to price in potential rate reductions later in 2026 if inflation continues to ease and growth softens, a shift from the tightening cycle of previous years.
Outlook and Implications for Crypto
This macroeconomic environment is generally favorable for risk assets. Cooling inflation and the prospect of a Fed easing have historically provided a tailwind to cryptocurrencies.
Within this context, Bitcoin and Ethereum are showing signs of bullish trend reversal after breakouts from Channel Down patterns. Pullbacks to $88K and $3K support levels, respectively, could present opportunities for swing traders.
If incoming data and Fed policy remain market-friendly, it could fuel a risk-on continuation, helping BTC push through six figures and ETH reclaim the mid-$3,000s. Traders should watch whether Bitcoin decisively clears ~$100K and Ethereum breaks the $3.4K - $3.5K zone – successful breakouts would signal another leg higher, while failure to do so, especially if accompanied by any macro jitters, could lead to a healthy near-term retracement in this otherwise positive market structure.
Author

Marek Hric
altFINS
Marek is a finance and capital markets professional with more than 9 years of experience from two top European banking groups. He is skilled in portfolio and risk management with focus on traditional fixed income and derivative financial instruments.


