BCH/USD technical analysis: Bitcoin Cash is testing a trendline on the hourly chart
- Bitcoin Cash is trading 1.54% lower as general crypto sentiment is weak.
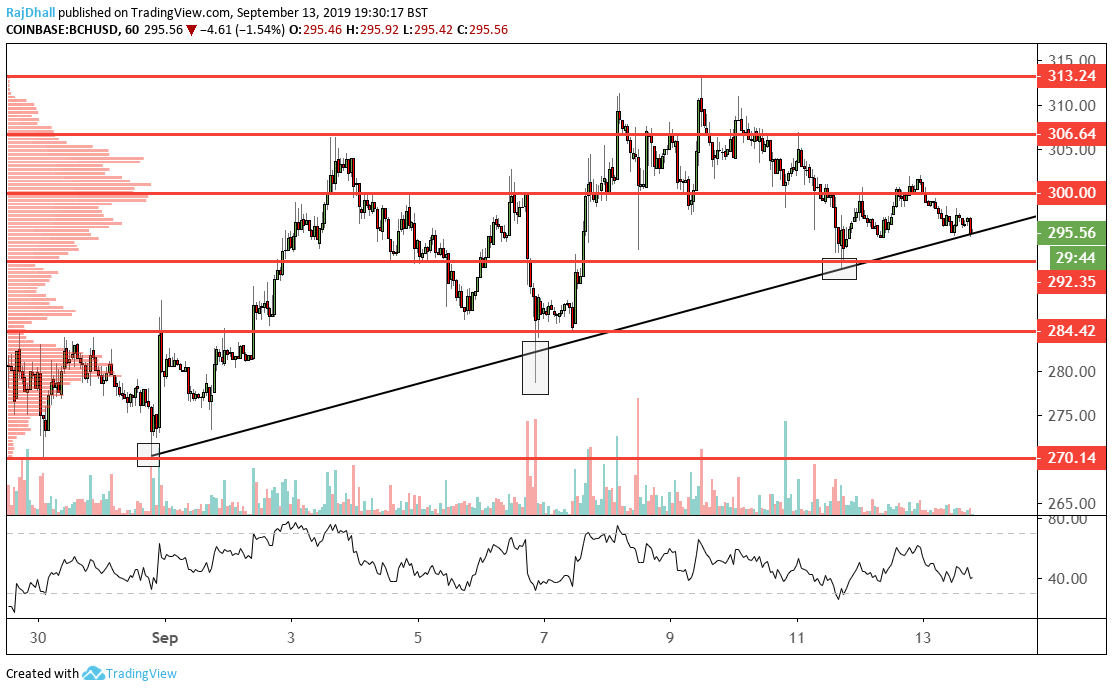
- There is a key trendline coming up after the market rejected 300 to the upside again.

On the Bitcoin Cash, the hourly chart price is about to test a key trendline. The uptrend started at the beginning of this month and price has consolidated around the 300 level.
The 300 level has been tested and rejected once more last night, with the BCH/USD pair now testing 295.00
Under this level, there are a few key support zones that could stop the price from falling lower. 292.35 was used as decent support on September 11th.
Beyond that, 284.42 is the more important one as it has been tested a few more times.
The RSI (Relative Strength Index) indicator hangs just under the mid-zone with lots of downside space.
Lastly, the volume profile indicator is showing us that the price is currently under the mean value area but the before mentioned 292.35 support could be important.
Author

Rajan Dhall, MSTA
FX Daily
Rajan Dhall is an experienced market analyst, who has been trading professionally since 2007 managing various funds producing exceptional returns.


