|

BCH/USD technical analysis: A break of 230.00 would be a positive sign

  • Bitcoin Cash is 1.14% in the black today and things could get better.
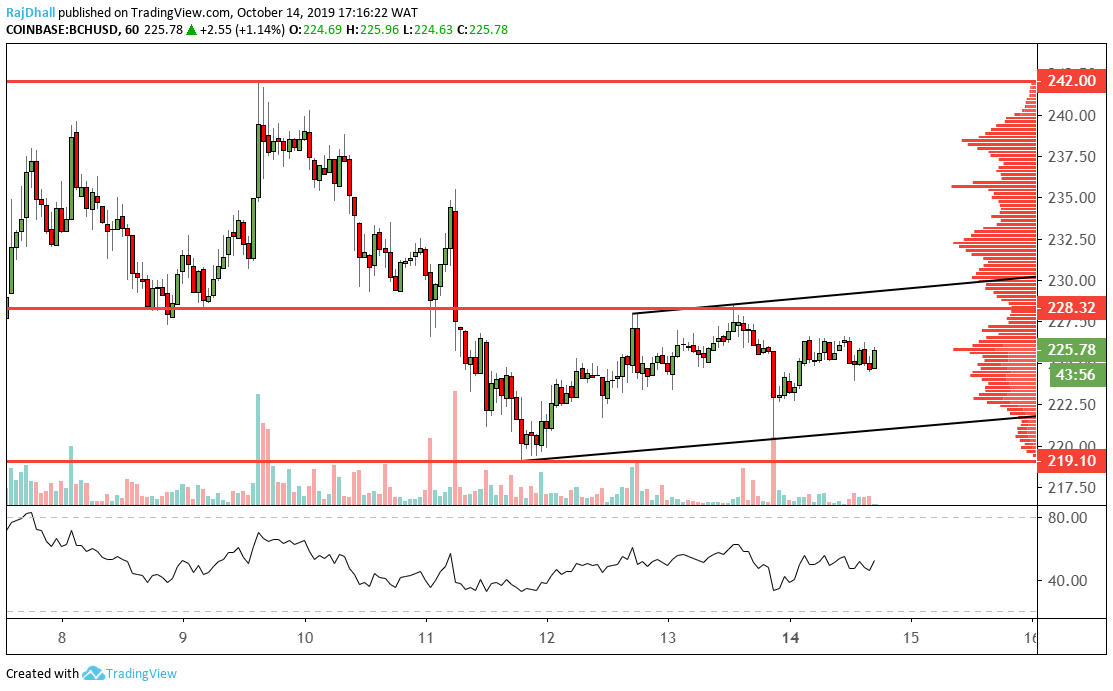
  • There is a technical pattern forming on the hourly chart but price action is looking choppy.

BCH/USD is looking positive today but we are in the middle of a technical pattern that could break either way. Price is currently at the mean value point of the current distribution area between 219 and 228.32. The price has currently made a lower high and if 220.00 breaks it will have a lower high lower low formation on the hourly chart. The relative strength index (RSI) indicator is turning south at the moment but the volume seems thin. On the daily chart, the price action is still in a downtrend but currently we are in a consolidation point. The pivotal point on the daily chart is the 200.00 base support level. On the upside 242.00 is the breakout point for the bulls to change the trajectory of the trend. Even on the daily timeframe volume is looking pretty think as it seems we are in an inflexion point were traders must decide on a longer-term trend. 

Bitcoin Cash Analysis

BCH/USD

Overview
Today last price225.9846
Today Daily Change2.7443
Today Daily Change %1.23
Today daily open223.2403
 
Trends
Daily SMA20225.9181
Daily SMA50270.898
Daily SMA100299.302
Daily SMA200324.5487
 
Levels
Previous Daily High228.5954
Previous Daily Low220.8531
Previous Weekly High241.9442
Previous Weekly Low215.3686
Previous Monthly High333.7339
Previous Monthly Low202.6094
Daily Fibonacci 38.2%223.8107
Daily Fibonacci 61.8%225.6378
Daily Pivot Point S1219.8638
Daily Pivot Point S2216.4873 
Daily Pivot Point S3212.1216
Daily Pivot Point R1227.6061 
Daily Pivot Point R2231.9719
Daily Pivot Point R3235.3484

Author

Rajan Dhall, MSTA

Rajan Dhall is an experienced market analyst, who has been trading professionally since 2007 managing various funds producing exceptional returns.

More from Rajan Dhall, MSTA
Share:

Editor's Picks

Ripple bulls defend key support amid waning retail demand and ETF inflows

XRP ticks up above $1.40 support, but waning retail demand suggests caution. XRP attracts $4 million in spot ETF inflows on Thursday, signaling renewed institutional investor interest.

Crypto Today: Bitcoin, Ethereum, XRP rebound as risk appetite improves

Bitcoin rises marginally, nearing the immediate resistance of $68,000 at the time of writing on Friday. Major altcoins, including Ethereum and Ripple, hold key support levels as bulls aim to maintain marginal intraday gains.

Bitcoin Weekly Forecast: No recovery in sight 

Bitcoin price continues to trade sideways between $65,729 and $71,746, extending its consolidation since February 7. US-spot ETFs record an outflow of $403.90 million through Thursday, pointing to the fifth consecutive week of withdrawals.

Pi Network Price Forecast: PI recovery stalls amid profit-taking

Pi Network tests 50-day EMA support on Friday, after a 5% decline the previous day. PiScan data shows large deposits on CEXs totaling over 4 million PI tokens in the last 24 hours, reflecting an exodus of investors taking profits.

Bitcoin Price Annual Forecast: BTC holds long-term bullish structure heading into 2026

Bitcoin (BTC) is wrapping up 2025 as one of its most eventful years, defined by unprecedented institutional participation, major regulatory developments, and extreme price volatility.

Bitcoin: No recovery in sight

Bitcoin (BTC) price continues to trade within a range-bound zone, hovering around $67,000 at the time of writing on Friday, and falling slightly so far this week, with no signs of recovery.