Band Protocol resumes uptrend to new all-time highs, aiming to catch up with Chainlink
- Band Protocol seems miles away from its local top following the inverse H&S pattern breakout.
- The IOMAP model reveals that BAND has a relatively smooth path to new record highs above $15.
- Chainlink is nurturing a possible breakout to new all-time highs around $30.

Band Protocol was at the forefront of recovery, especially in the last week of January. A technical breakout saw it rise to levels above $13 but failed to subdue the resistance at $14. Meanwhile, the bullish outlook seems far from over, with gains likely to hit $15 in the near-term.
Band Protocol bulls busy hunting for higher support
Following the breakout from a symmetrical triangle, BAND almost hit its 37% target. The bullish leg, however, ran into a barrier at $13.02, giving way for correction. At the moment, Band Protocol is doddering at $11.96 amid the hunt for higher support.
Gains above $13 will validate the uptrend, by encouraging investors and bulls to hold longer in anticipation of another liftoff, perhaps to new all-time highs around $15.
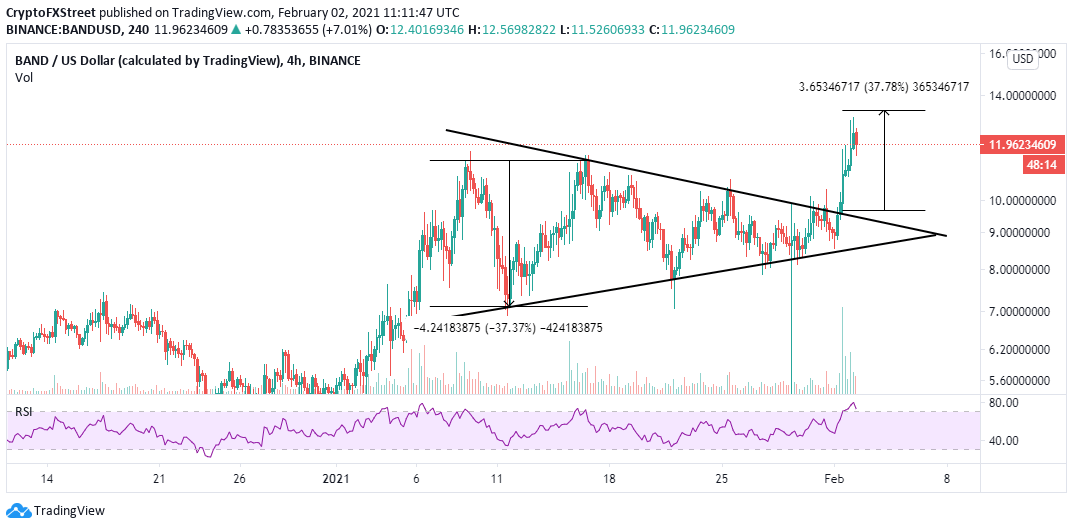
BAND/USD 4-hour chart
The daily chart illustrates the formation of an inverse head-and-shoulder (H&S) pattern. The recent break above the bullish technical pattern added credibility to the upswing, slightly above $13. Despite stalling at the barrier mentioned above, the H&S pattern target rests around $15, suggesting that the bull run is still in the cards.
The bullish outlook appears to be validated by the Relative Strength Index. The technical indicator, which measures a trend's strength, is still moving towards the overbought region. In other words, Band Protocol is not quite overbought and room for growth still exists.
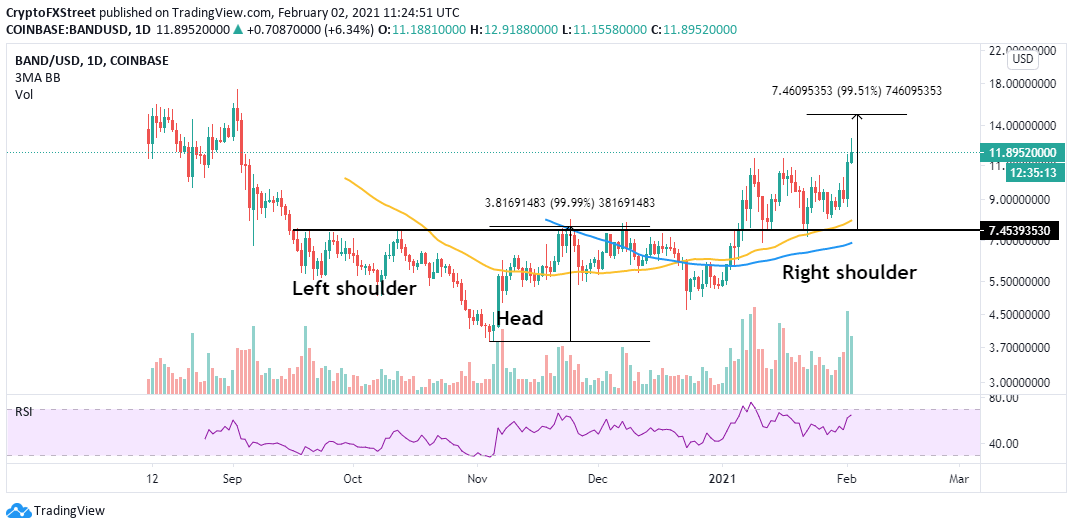
BAND/USD daily chart
IntoTheBlock's IOMAP chart seems to have added credence to the bullish narrative by revealing the absence of immense resistance ahead of Band Protocol. However, it is essential to realize that buyers must pay attention to the subtle resistance between $13.2 and $13.6.
Here, 674 addresses had previously purchased nearly 53,500 BAND. Trading above this zone will leave Band Protocol with open-air to explore new record highs.
On the other hand, BAND is sitting in an area with a high concentration of buyers, running from $10.4 and $10.7. Previously, 535 addresses had bought roughly 2.2 million BAND from the range. It is improbable that bears will slice through the support; hence the least resistance path is upwards.
-637478660647874197.png)
Band Protocol IOMAP model
Chainlink fight for an upswing toward $30
Chainlink outperformed other altcoins to post incredible gains in January. Despite overcoming 2020's stubborn resistance at $20, LINK soared to new all-time highs around $27.6. A correction ensued, forcing Chainlink to confirm support at $20.
Meanwhile, recovery is underway within the confines of an ascending parallel channel, as observed on the daily chart. The channel's middle barrier must be pushed in the rearview to sustain the uptrend. Nonetheless, trading above the upper edge would catapult Chainlink to $30 (new record high).
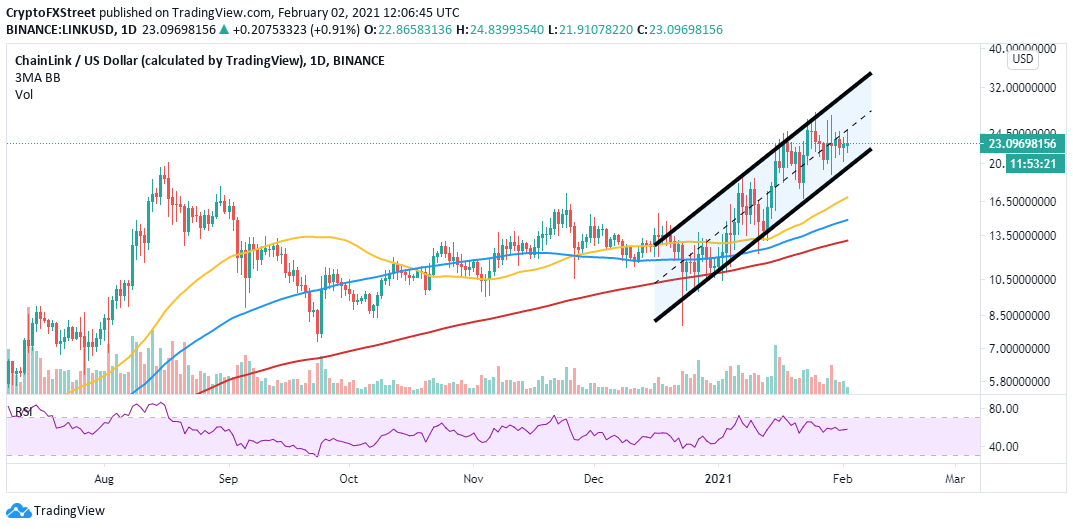
LINK/USD daily chart
Chainlink whales still on a buying spree
Chainlink boasts of some of the most loyal holders who believe in the cryptocurrency's future. This can be reflected by an increase in whales holding between 100,000 and 1 million LINK. After bottoming at 266 on January 23, the addresses have risen to 278, representing a 4.3% growth.
Although the percentage rise may seem insignificant at first, the volume the whales move is massive enough to increase buying pressure. If Chainlink upsurges above its all-time high at $27.6, more investors are likely to be attracted to join the market in anticipation of new record highs above $30.
%20[15.15.39,%2002%20Feb,%202021]-637478660227521251.png)
Chainlink holder distribution
Looking at the other side of the picture
Chainlink may fail to rise to the new record highs if the ongoing uptrend becomes unstainable within the ascending channel. A breakdown under this pattern could have a substantial impact, leading to massive losses under $20. Support levels to keep in mind are the 50 Simple Moving Average at $16.5, the 100 SMA at $15 and the 200 SMA at $13.
Author

John Isige
FXStreet
John Isige is a seasoned cryptocurrency journalist and markets analyst committed to delivering high-quality, actionable insights tailored to traders, investors, and crypto enthusiasts. He enjoys deep dives into emerging Web3 tren


