Ethereum Price Forecast: ETH strengthens against BTC post-Fusaka, targeting $3,200 breakout
- Ethereum trades above $3,100 on Friday, with bulls aiming for a breakout above a two-month-old resistance trendline.
- Ethereum gains strength against Bitcoin as demand for the major altcoin increases after the Fusaka upgrade.
- On-chain data shows increased interest among large wallet investors while the derivatives and ETF markets remain mixed.

Ethereum (ETH) swells over 1% at press time on Friday, extending its struggle at the confluence of the local resistance trendline and an overhead supply zone. The demand for the major altcoin is on the rise after its Fusaka upgrade on Wednesday among large wallet investors, strengthening it against Bitcoin (BTC) in the short term.
Still, the derivatives and ETH-focused Exchange Traded Fund (ETFs) markets remain mixed.
Fusaka upgrade boosts Ethereum against Bitcoin
Ethereum rolled out its Fusaka upgrade on Wednesday, increasing the gas limit to allow more transactions per block and potentially reducing gas fees. Additionally, the upgrade introduces minimum blob fees that prevent gas fees from shrinking to zero during quiet periods, and PeerDAS, which reduces storage and bandwidth requirements for nodes while expanding blob capacity by eightfold.
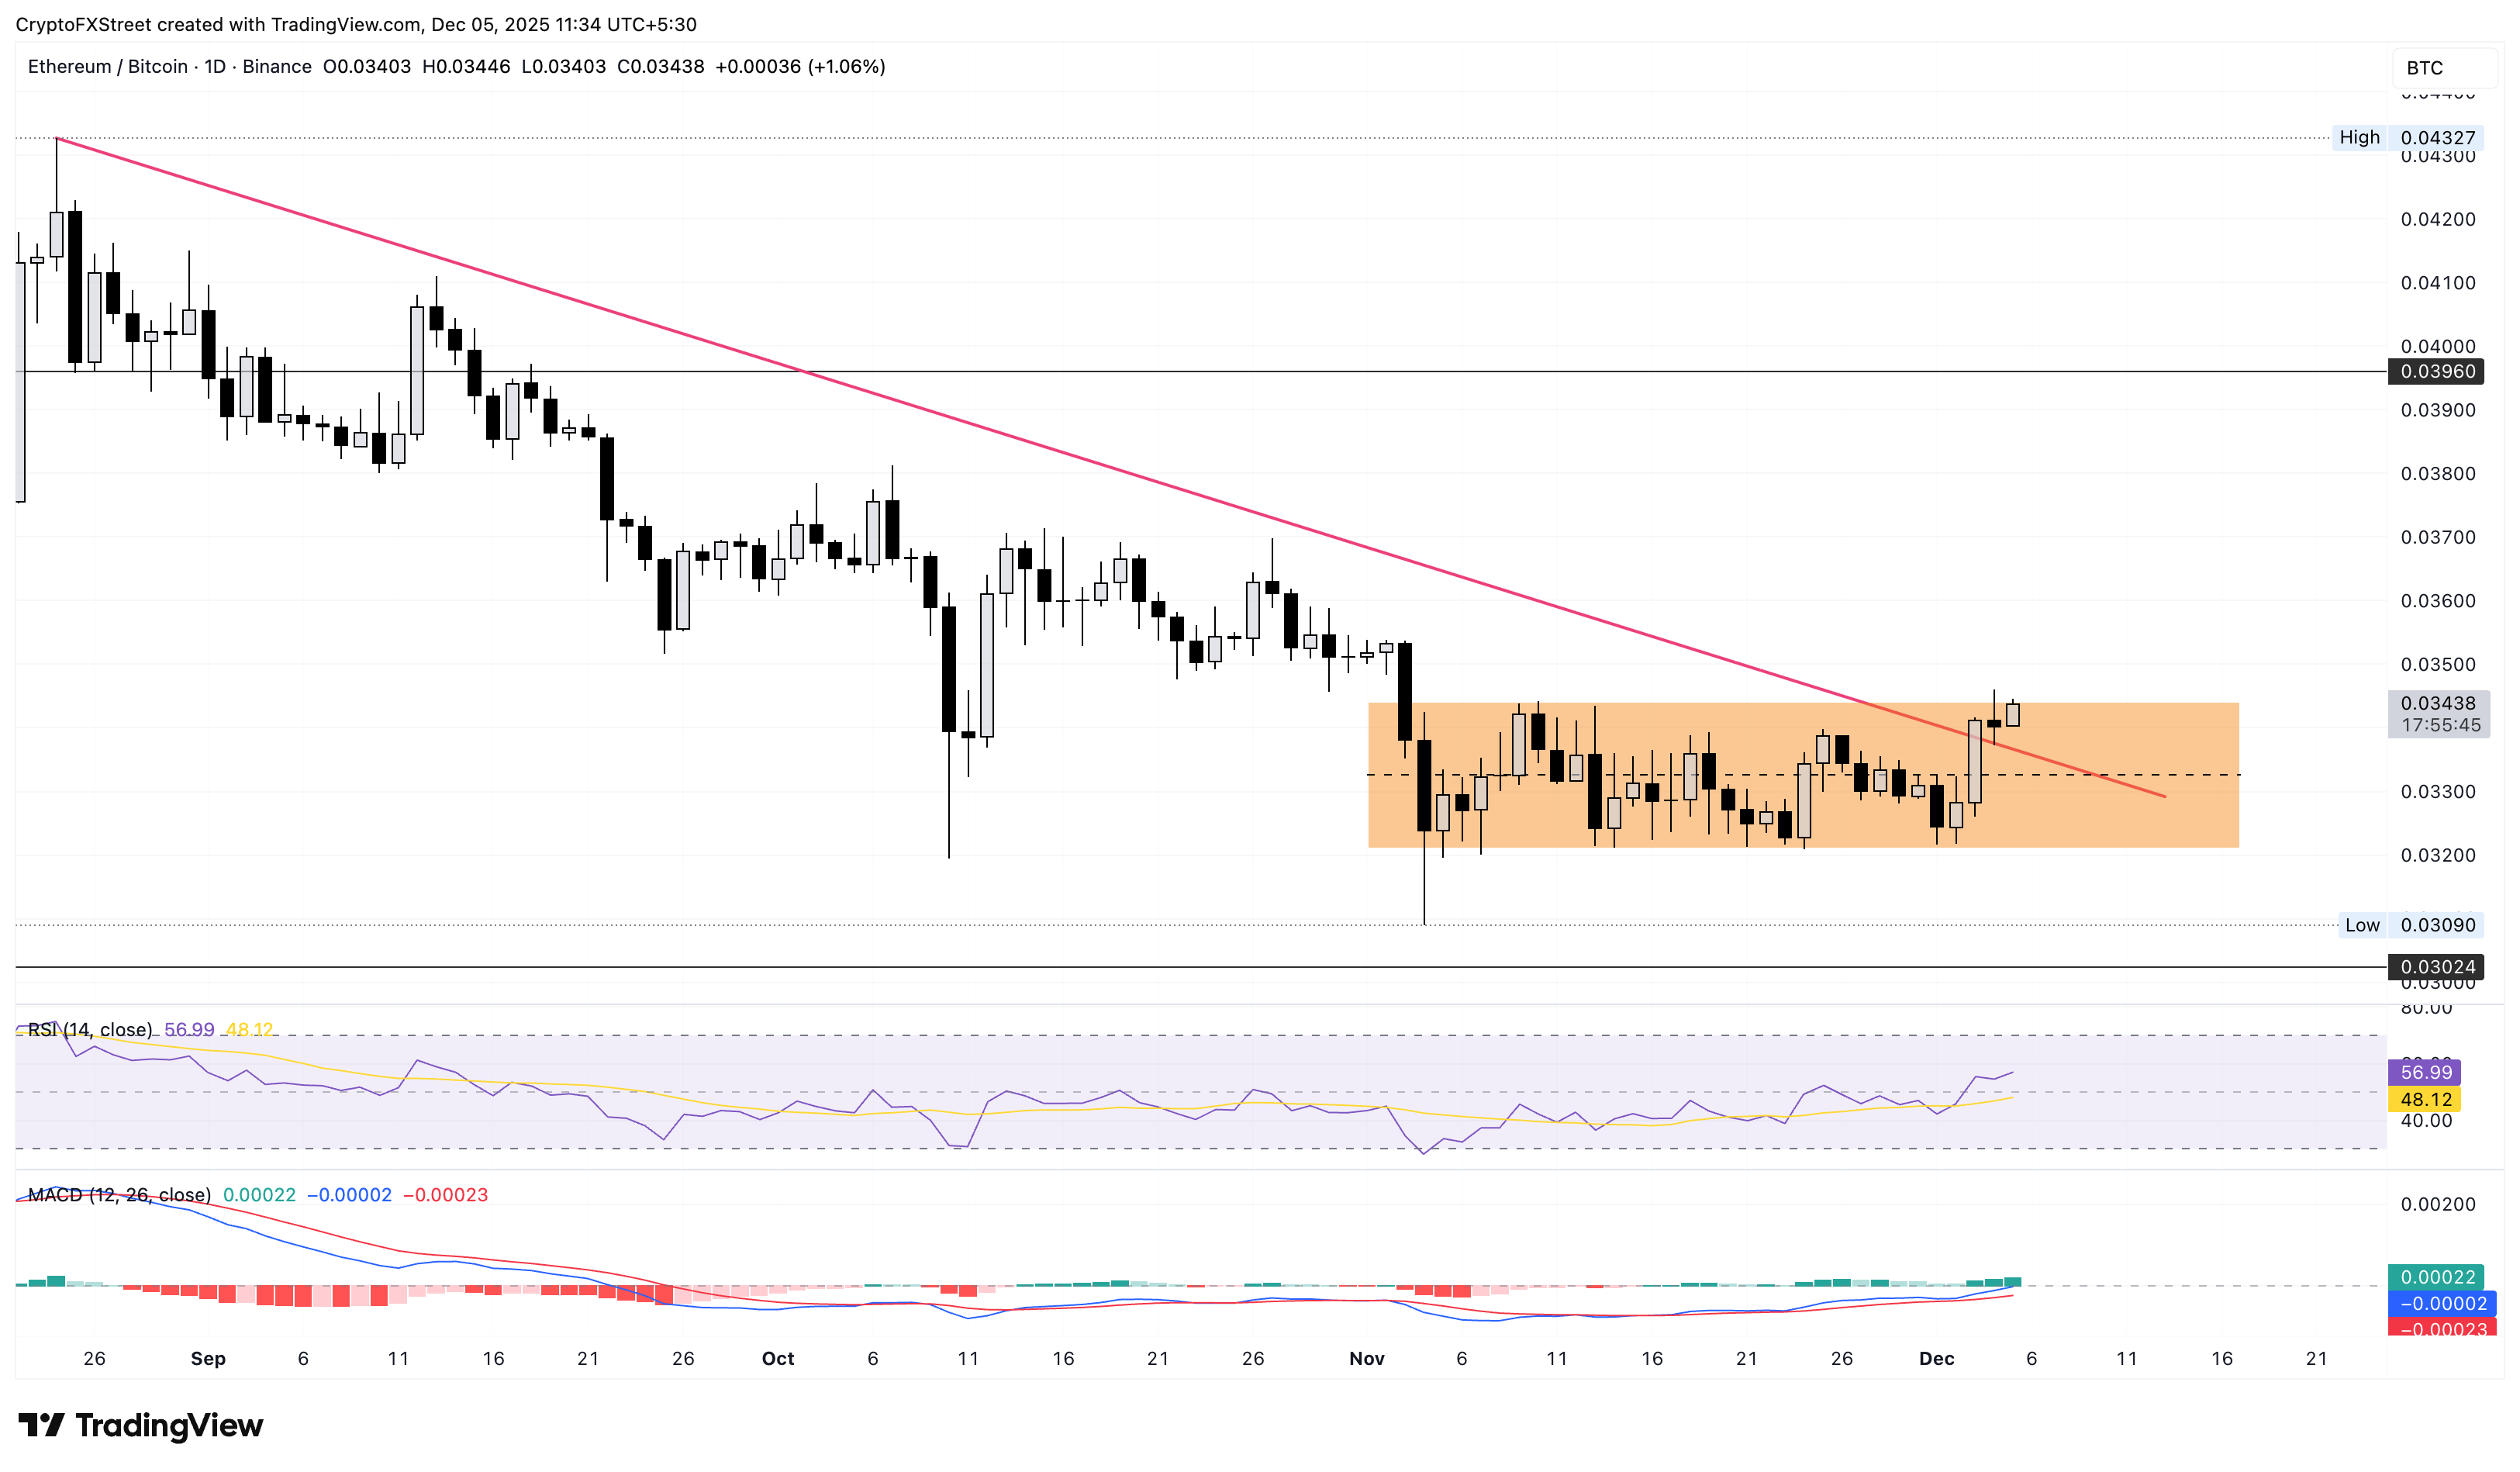
Following the release of new infrastructure, Ethereum increased nearly 4% against Bitcoin on Wednesday, securing a daily close above the resistance trendline connecting the highs of August 24 and October 27 on the daily logarithmic chart.
The ETH/BTC pair is rising by 1% at press time on Friday, aiming for a close above a consolidation range between the November 10 high of 0.03442 BTC and the November 24 low of 0.03209 BTC. A decisive close above this level could confirm the bullish breakout of the range, potentially further strengthening the major altcoin against Bitcoin. Notably, a rise in ETH/BTC often coincides with the altcoin season, which could signal a surge in the broader market risk appetite.
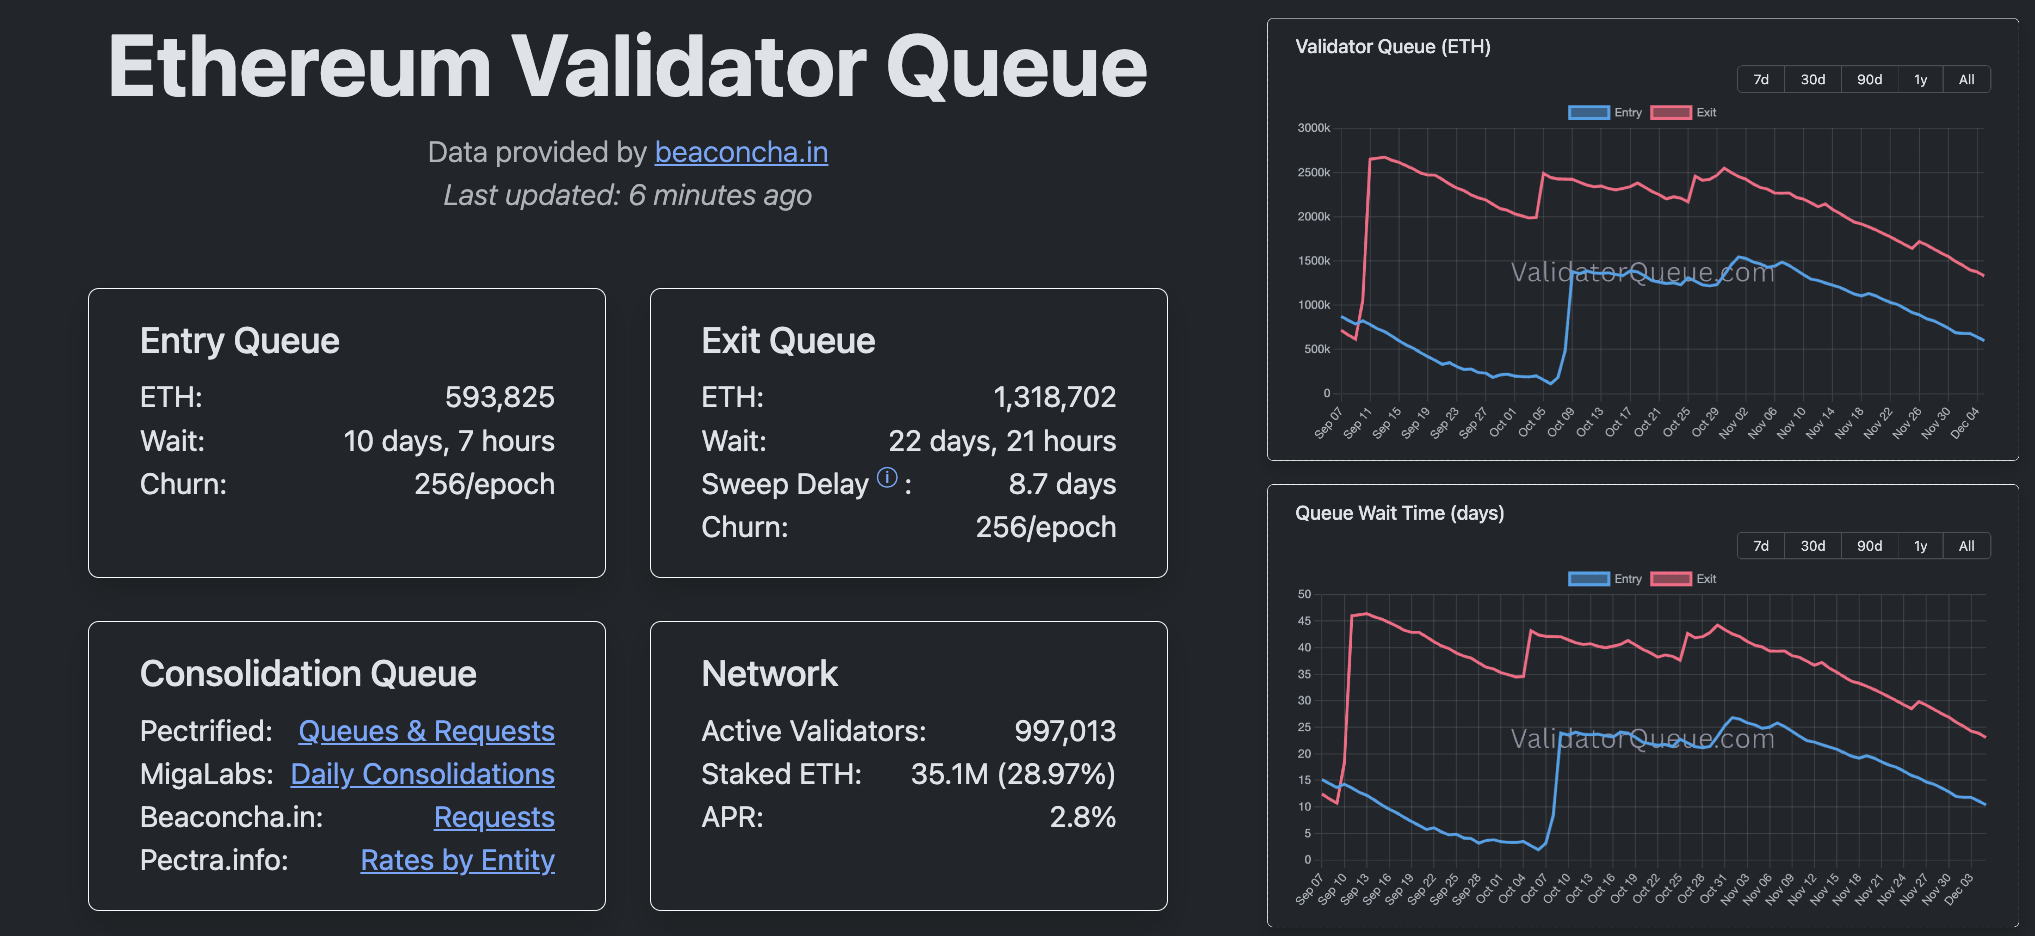
However, on the network side, the decline in validator entry and exit rates, and in queue time, continues despite the Fusaka upgrade, indicating a steady decrease in staking momentum.
On-chain ETH holders remain bullish as retail and institutions stay mixed
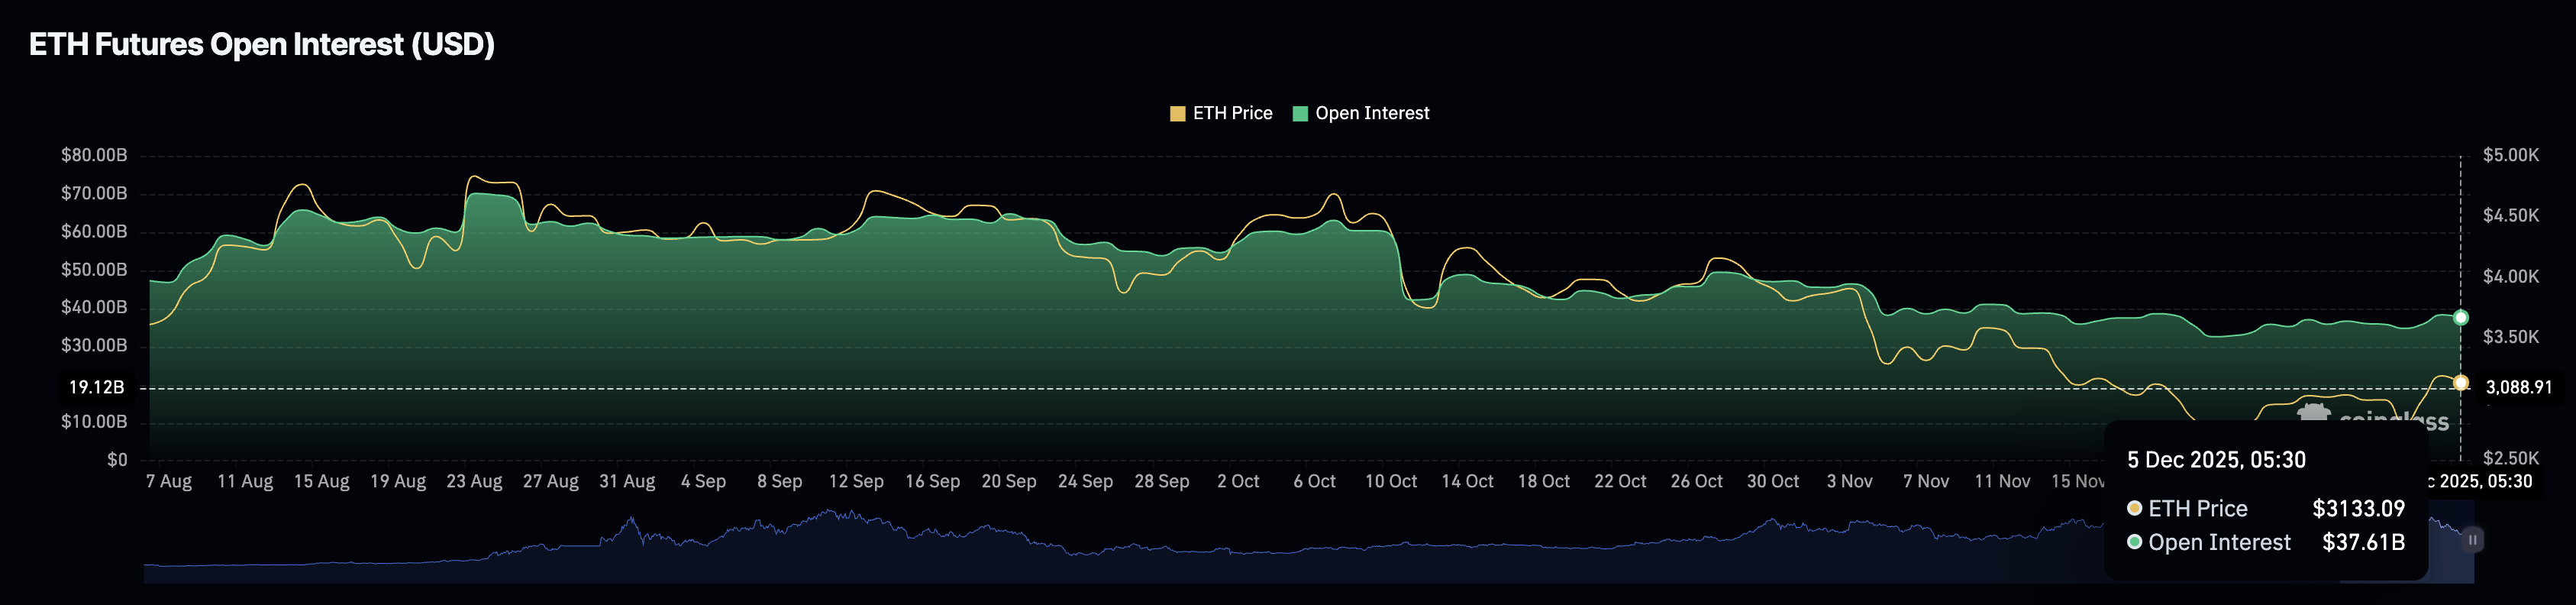
Ethereum lacks sustained interest from retail and institutional investors, as indicated by derivatives data and ETF flows. CoinGlass data shows ETH futures Open Interest (OI) at $37.61 billion on Friday, roughly flat since early November, suggesting reduced investor interest.
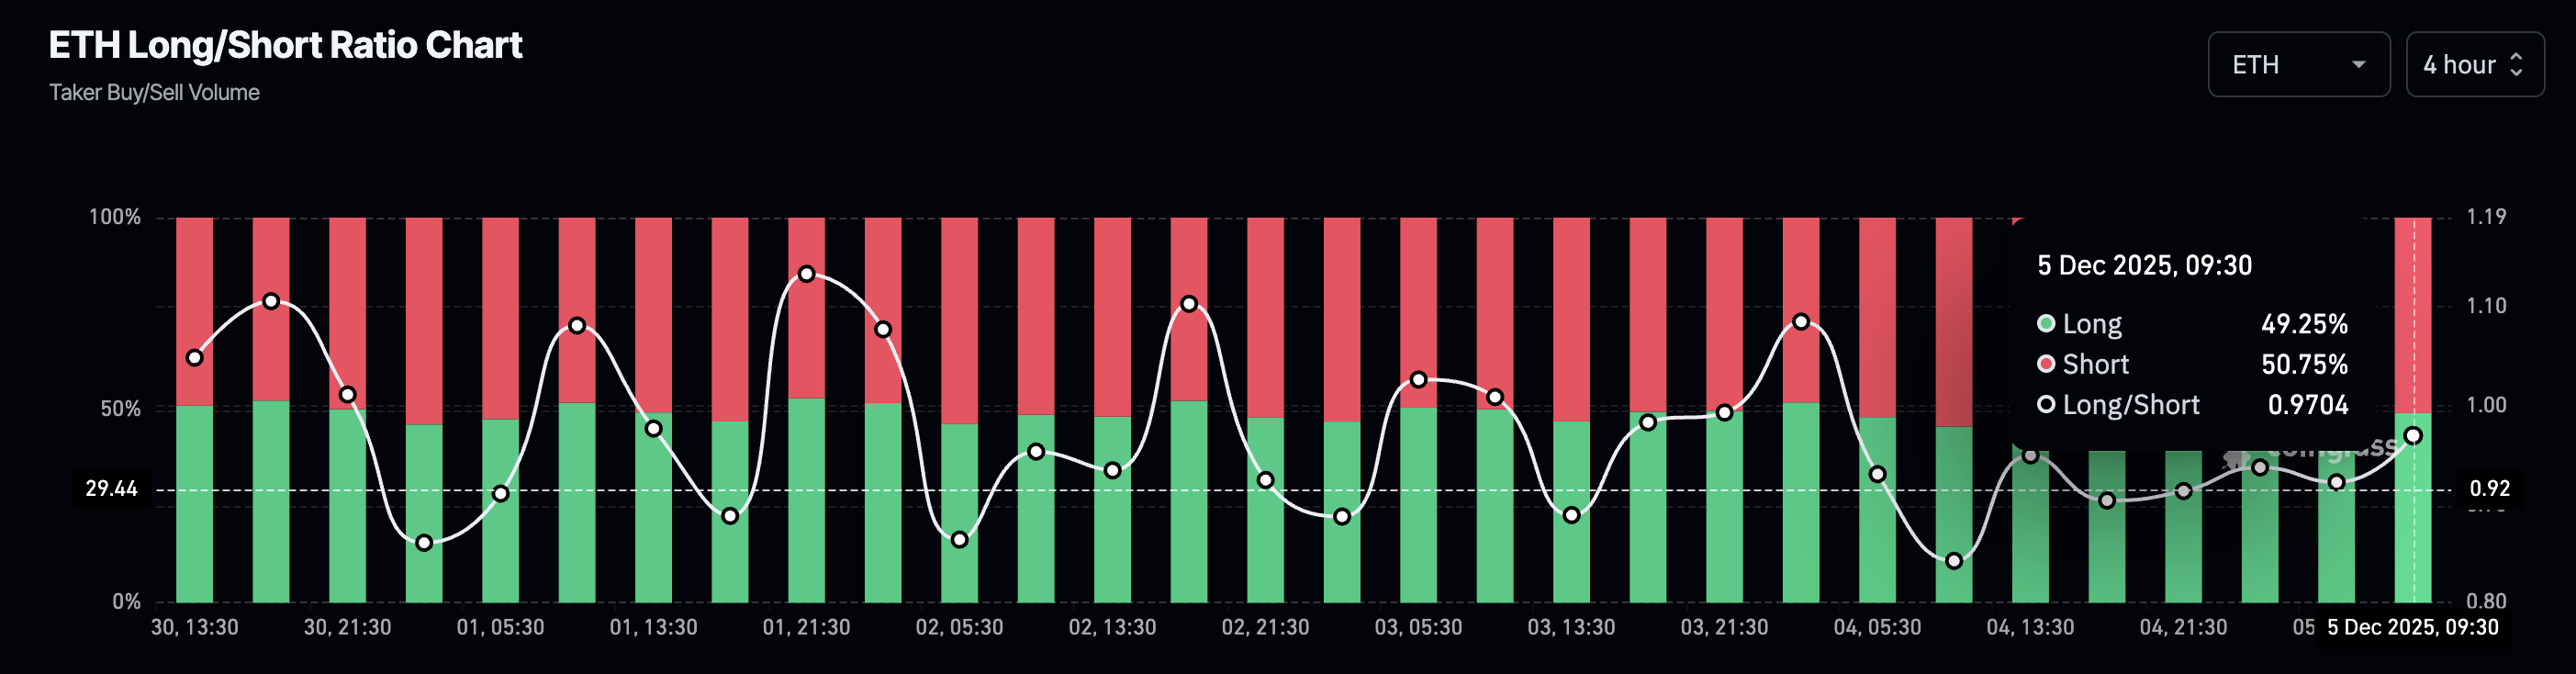
However, the long/short ratio chart shows a reduction in bearish positional buildup over the last 24 hours, from 54.22% on Thursday to 50.75% on Friday.
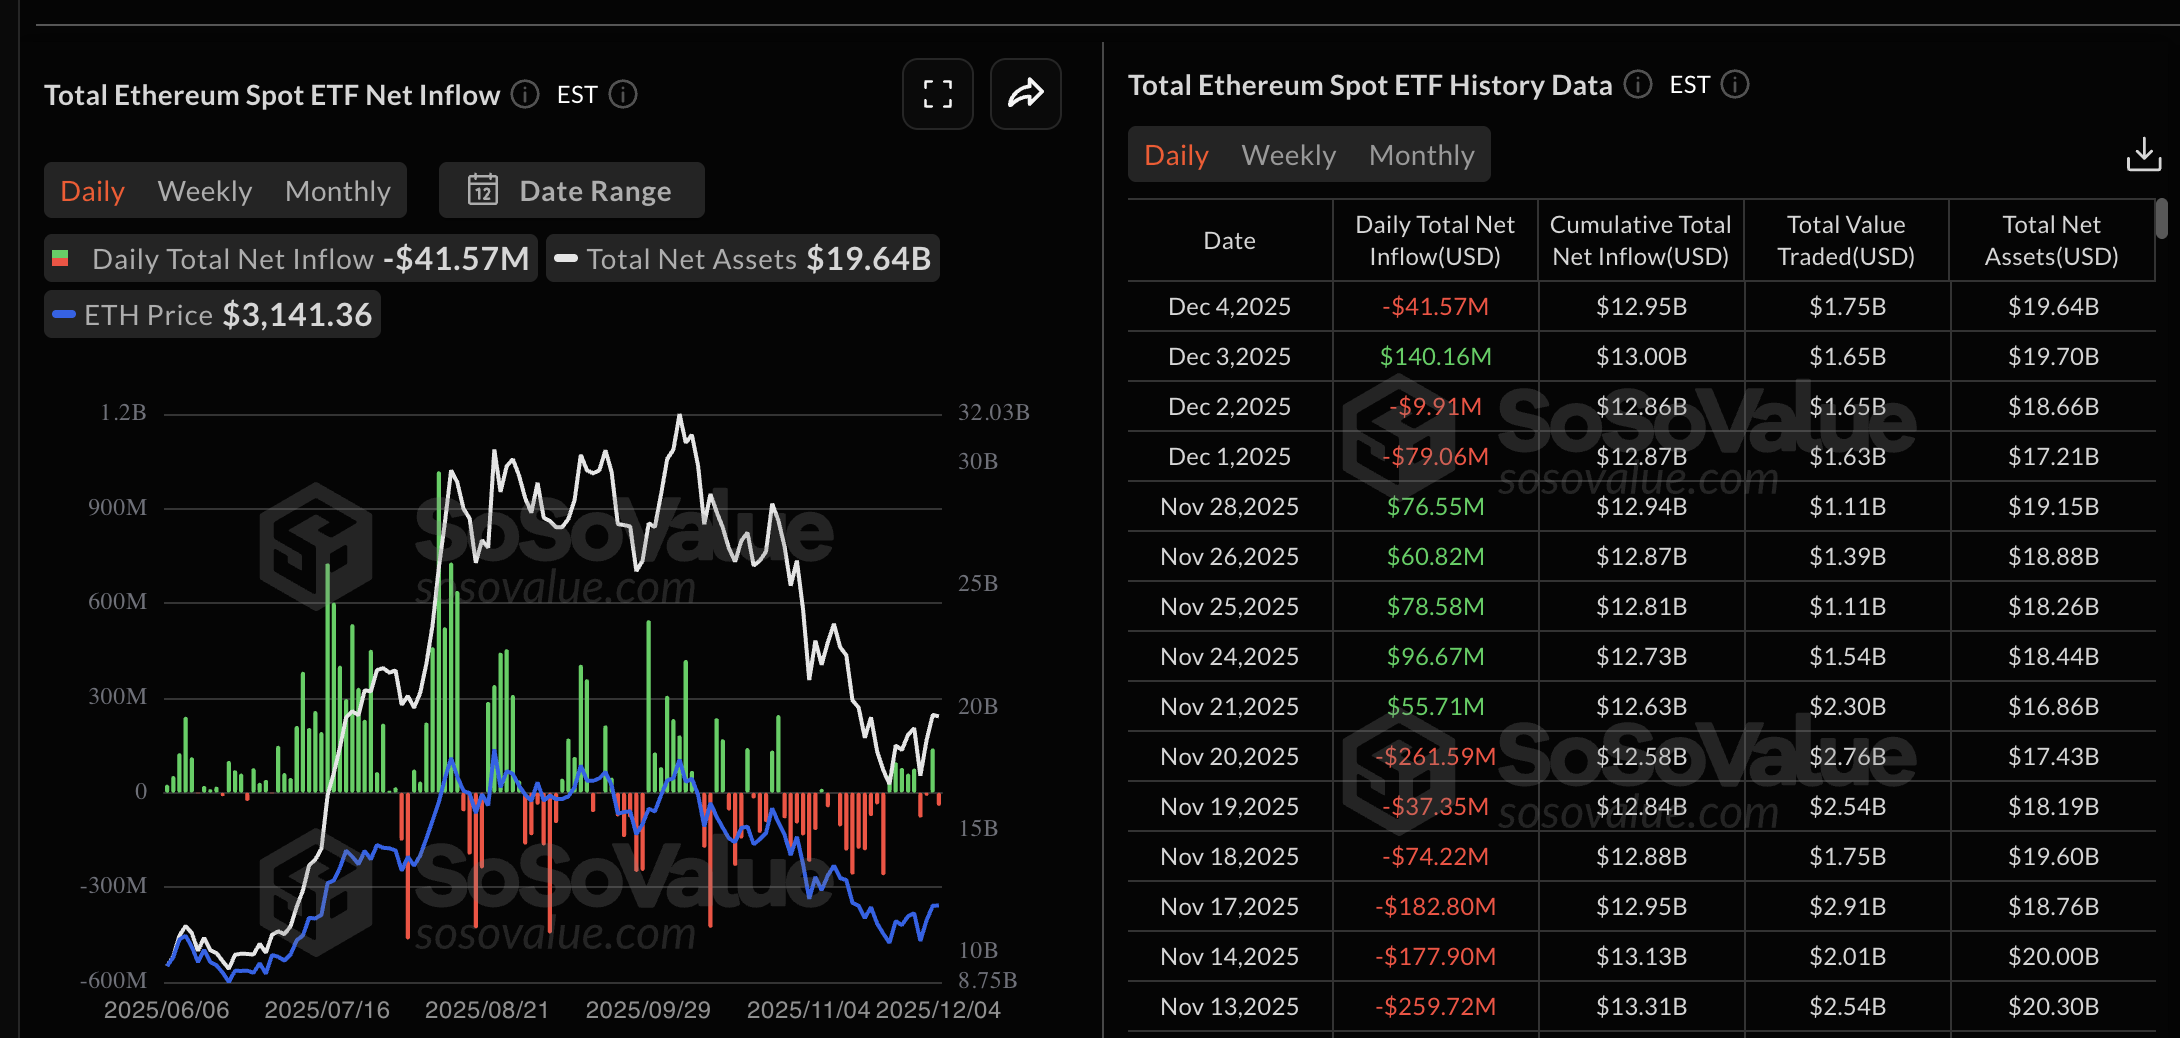
Meanwhile, US spot ETH ETFs recorded a net outflow of $41.57 million on Thursday, after a net inflow of $140.16 million on the release of the Fusaka upgrade the previous day. The lack of clarity about institutional support after the upgrade sends mixed signals to institutional investors.
Still, on-chain holders remain confident, as the cumulative holdings of large wallet investors with 1 million to 100 million ETH reached 80.28 million ETH on Friday, up from 75.86 million ETH on October 1.
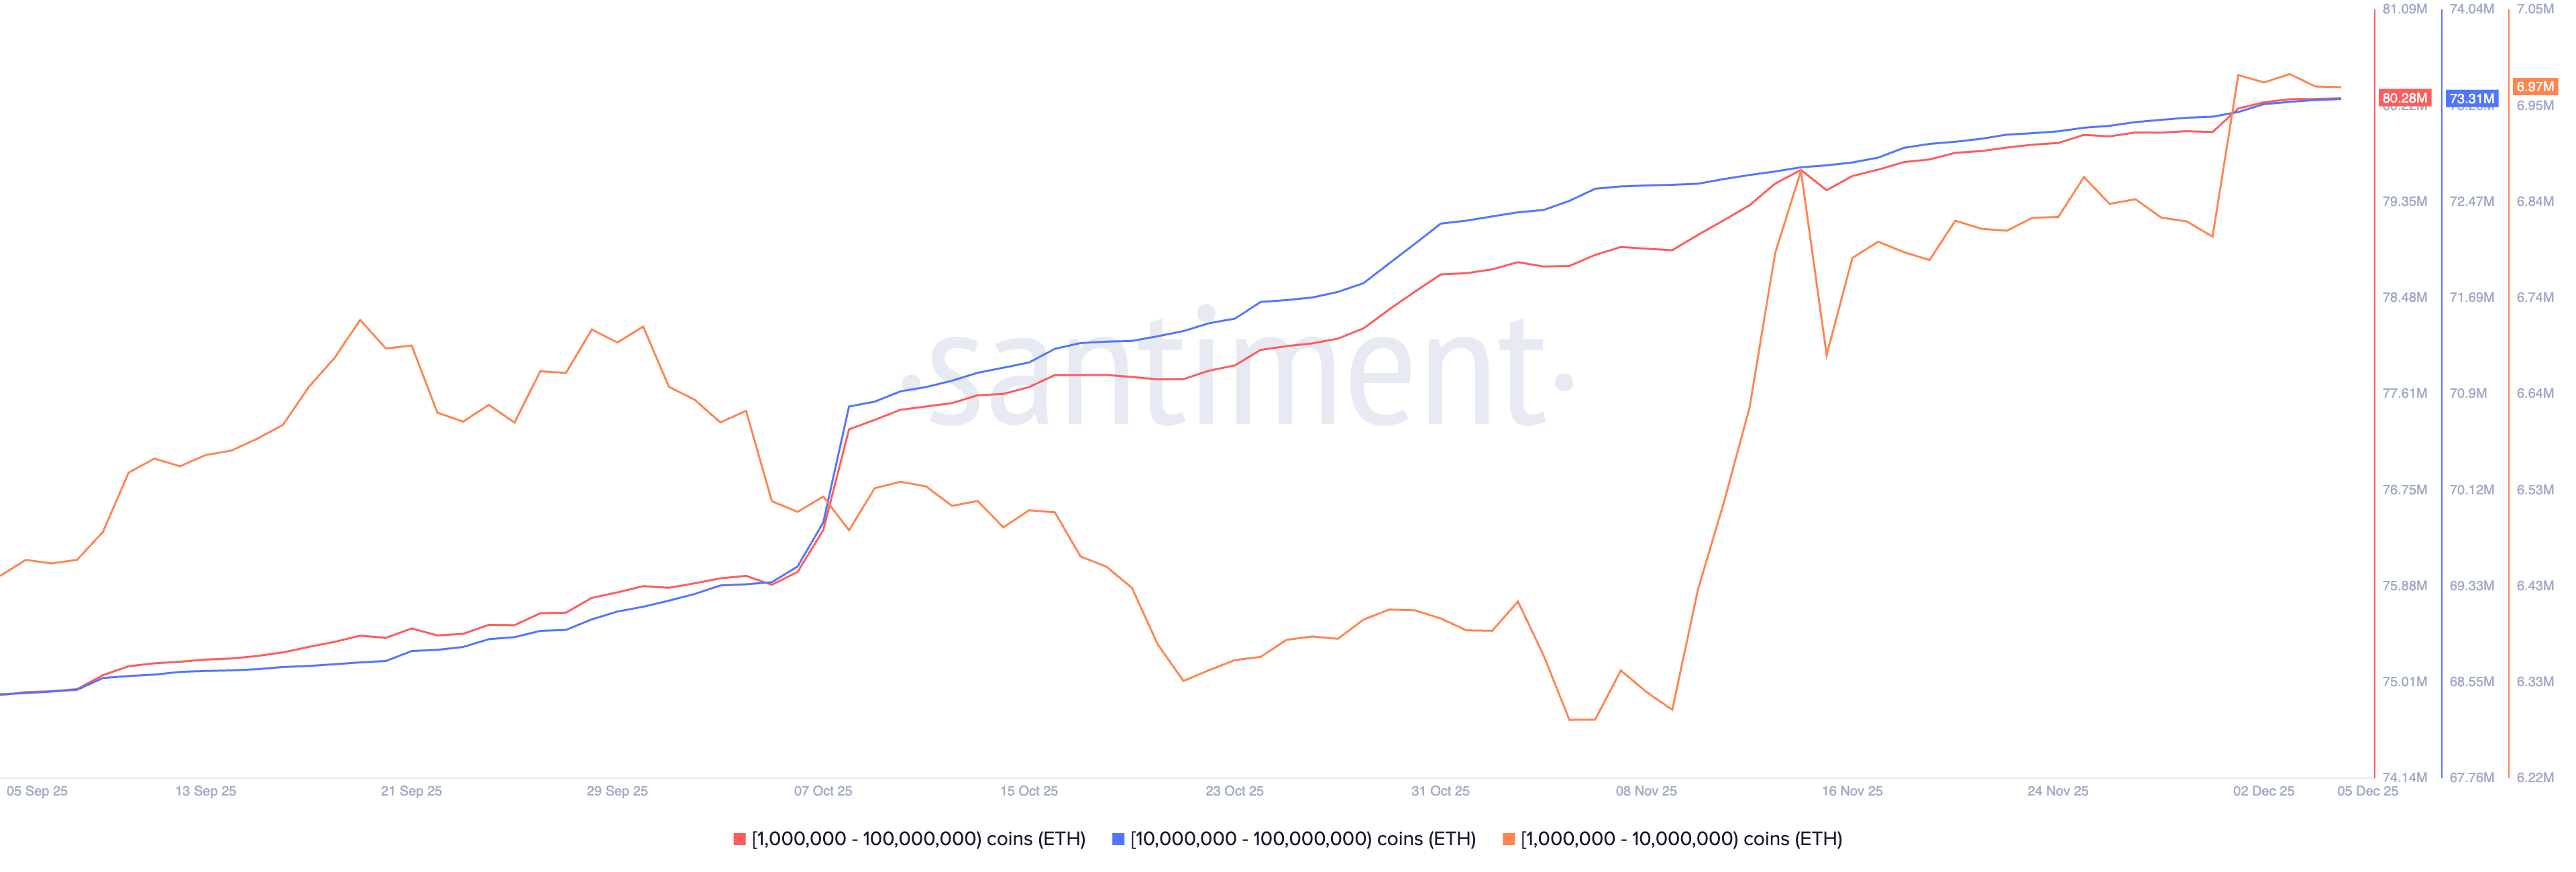
Overall, the confidence among on-chain holders remains steady compared to retail and institutional support that fluctuates relatively sharply with the broader market conditions.
Technical outlook: Will Ethereum exceed $3,200?
Ethereum faces headwinds near $3,200 from an overhead resistance trendline formed by connecting the October 7 and 27 highs on the daily chart. This trendline completes a larger falling wedge pattern, which typically results in an upside breakout.
To confirm the breakout, Ethereum must sustain a daily close above the support-turned-resistance zone between $3,225 and $3,287. A potential breakout rally in ETH could target the next resistance zone between $3,643 and $3,682.
The momentum indicators on the daily chart show a neutral to bullish signal. The Relative Strength Index (RSI) at 51 hovers near the halfway line, and at the same time, the Moving Average Convergence Divergence (MACD) indicates prevailing bullish momentum, as the average lines trend upward and close toward the zero line.
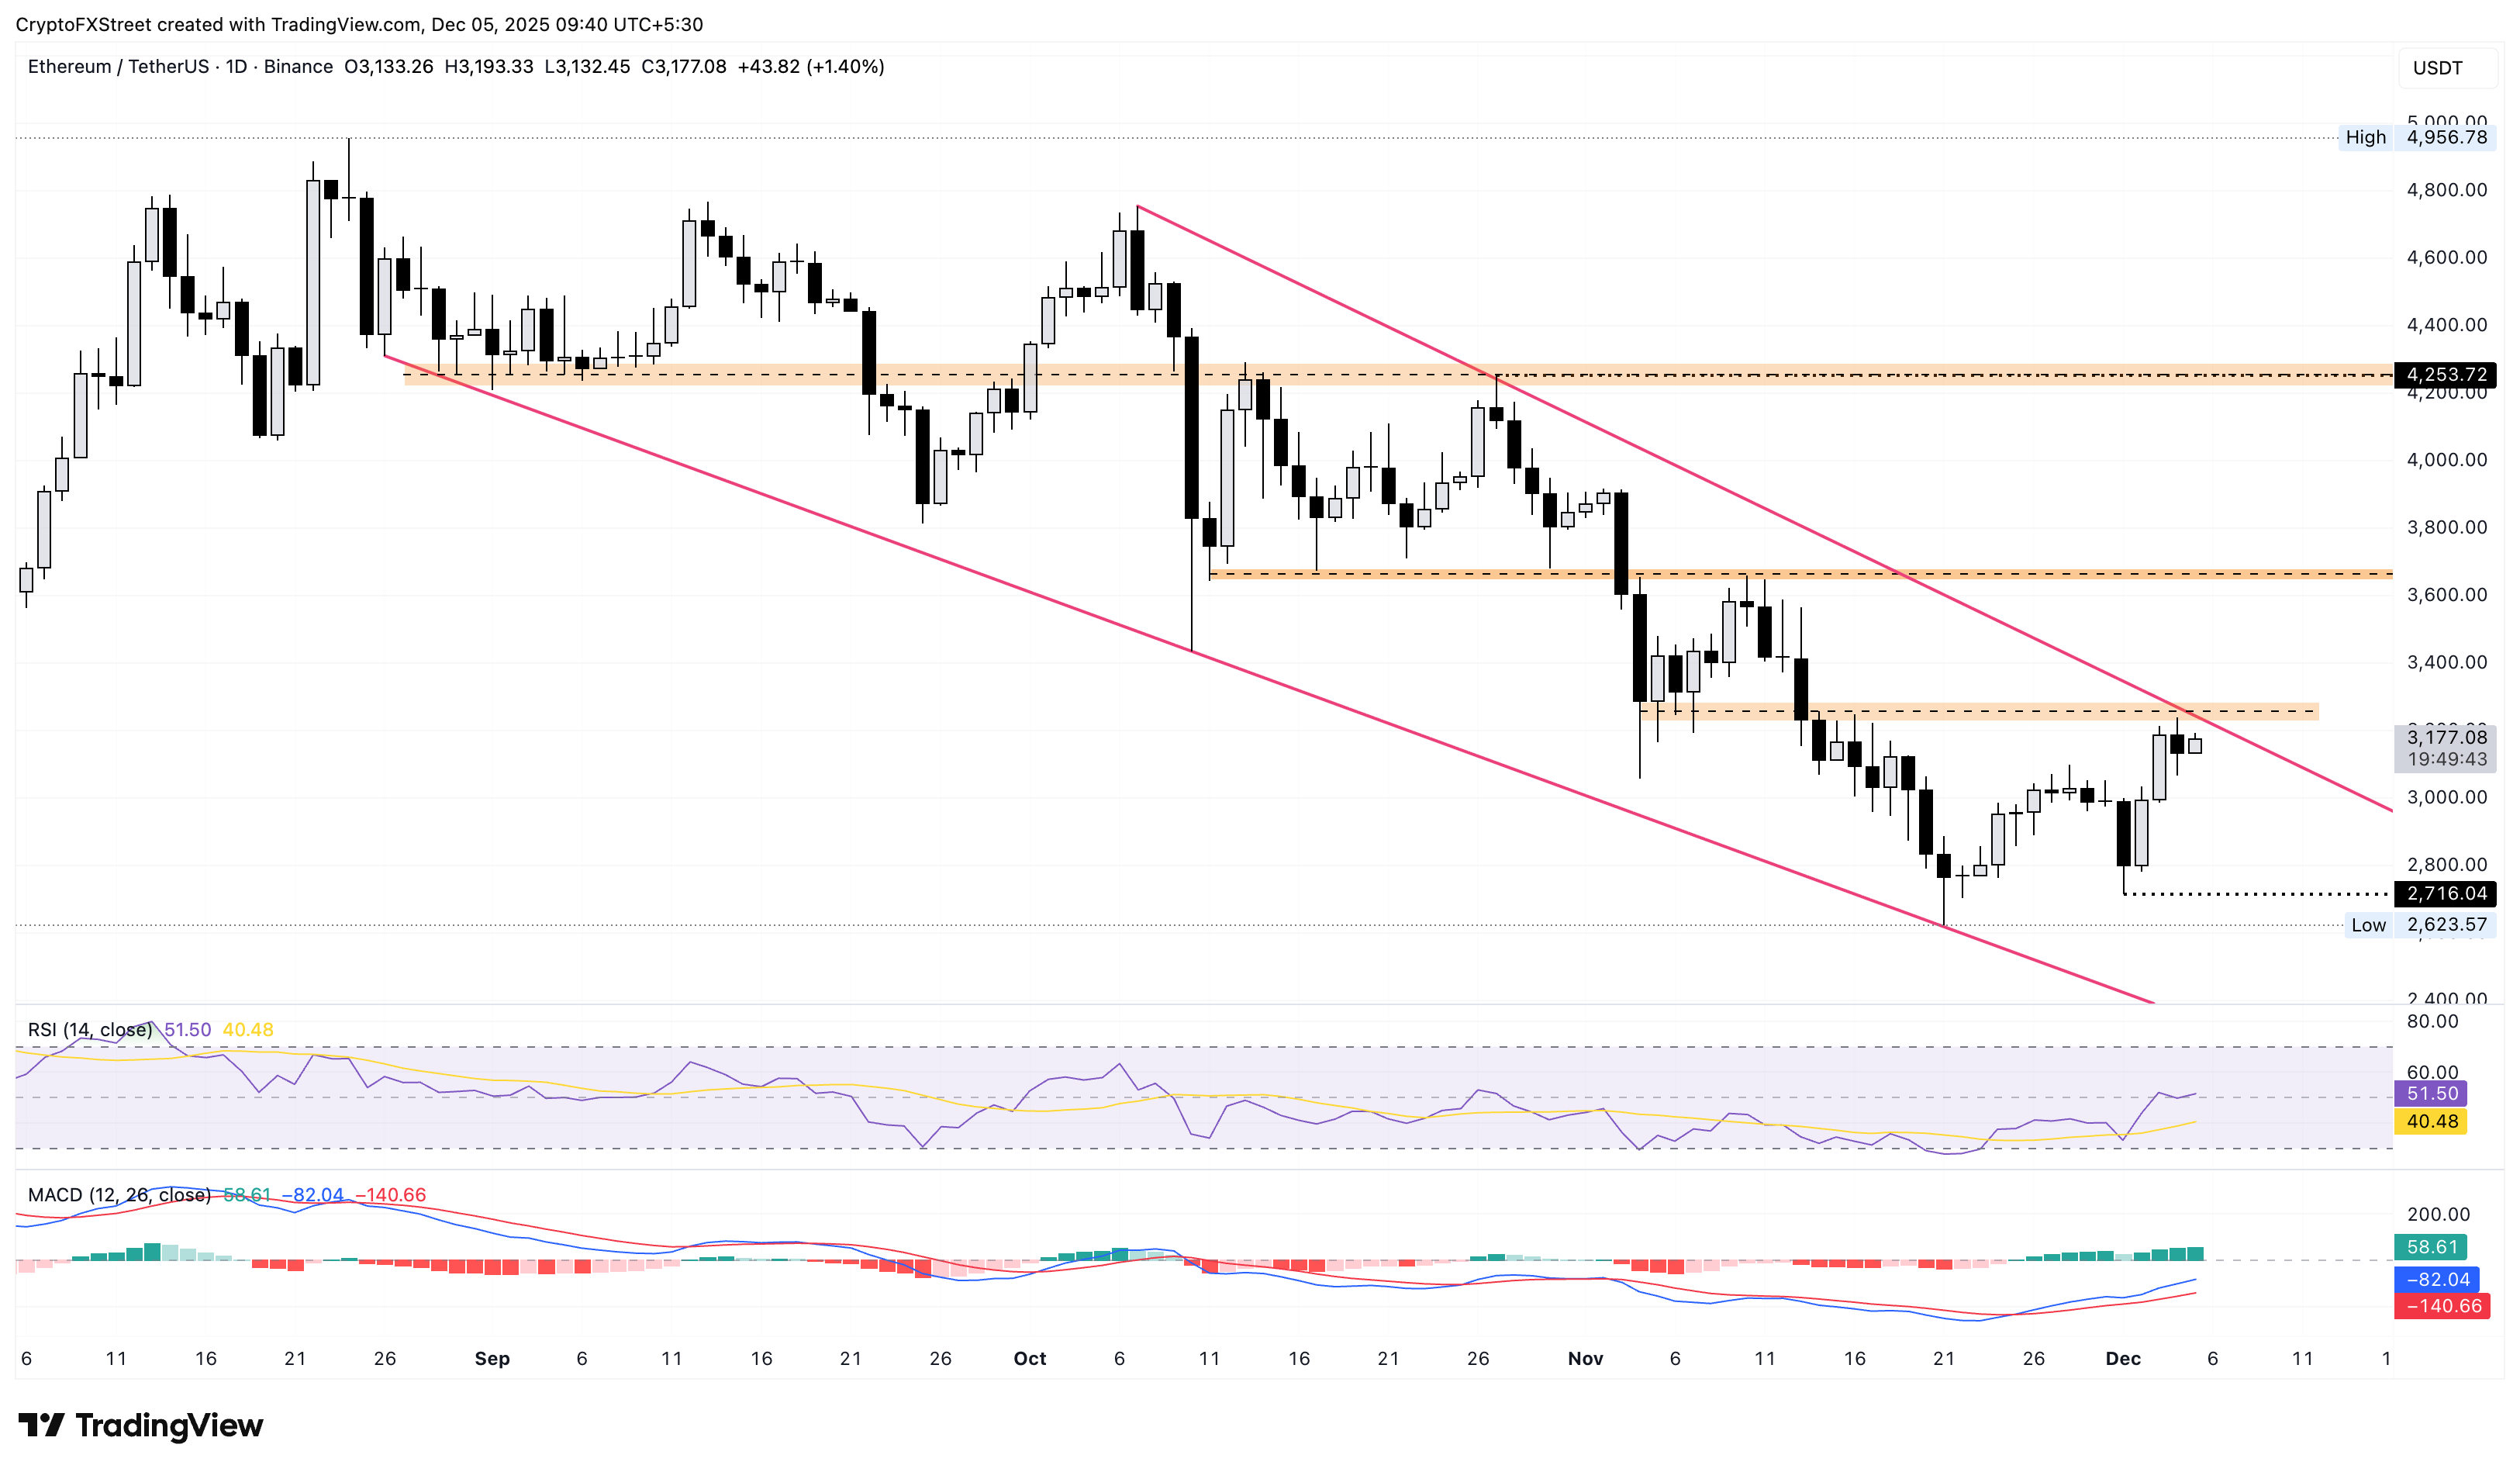
However, if Ethereum fails to hold above $3,000, it could revisit Monday’s low at $2,716.
Author

Vishal Dixit
FXStreet
Vishal Dixit holds a B.Sc. in Chemistry from Wilson College but found his true calling in the world of crypto.


