- Avalanche price action sees bulls dipping toes in to buy stakes.
- AVAX price is up for today, but a bull trap and longer-term downtrend are set to be triggered by an extensive technical event.
- Should more dollar strength come into the equation, expect to see AVAX drop below $50.
Avalanche (AVAX) is set to shed around 36% of its market cap as, although being on the front foot at the moment, a broader technical bearish signal is set to be triggered. A death cross is when the 55-day Simple Moving Average crosses below the 200-day SMA – as is currently happening on AVAX. Expect Avalanche price to hit $76 sometime today and then eventually drop to the downside as dollar strength will outweigh the current uptick.
Greenback is no match for AVAX bulls and sets the stage for a further pullback
Avalanche price action is under pressure after another weekend of losses, with the price dropping below $70 intermediary support at the open. Although AVAXis bouncing a bit at the moment, a very bearish signal is just ahead as the 55-day SMA is on the cusp of dropping below the 200-day SMA, triggering a massive inflow of bears that will look to short-sell AVAX across the board, possible resulting in price action being slashed by 36%. Add to that the dollar strength, and expect bulls to be outmatched each time by the weight of the dollar, overpowering investors that look to enter too soon so as to preposition for the relief rally.
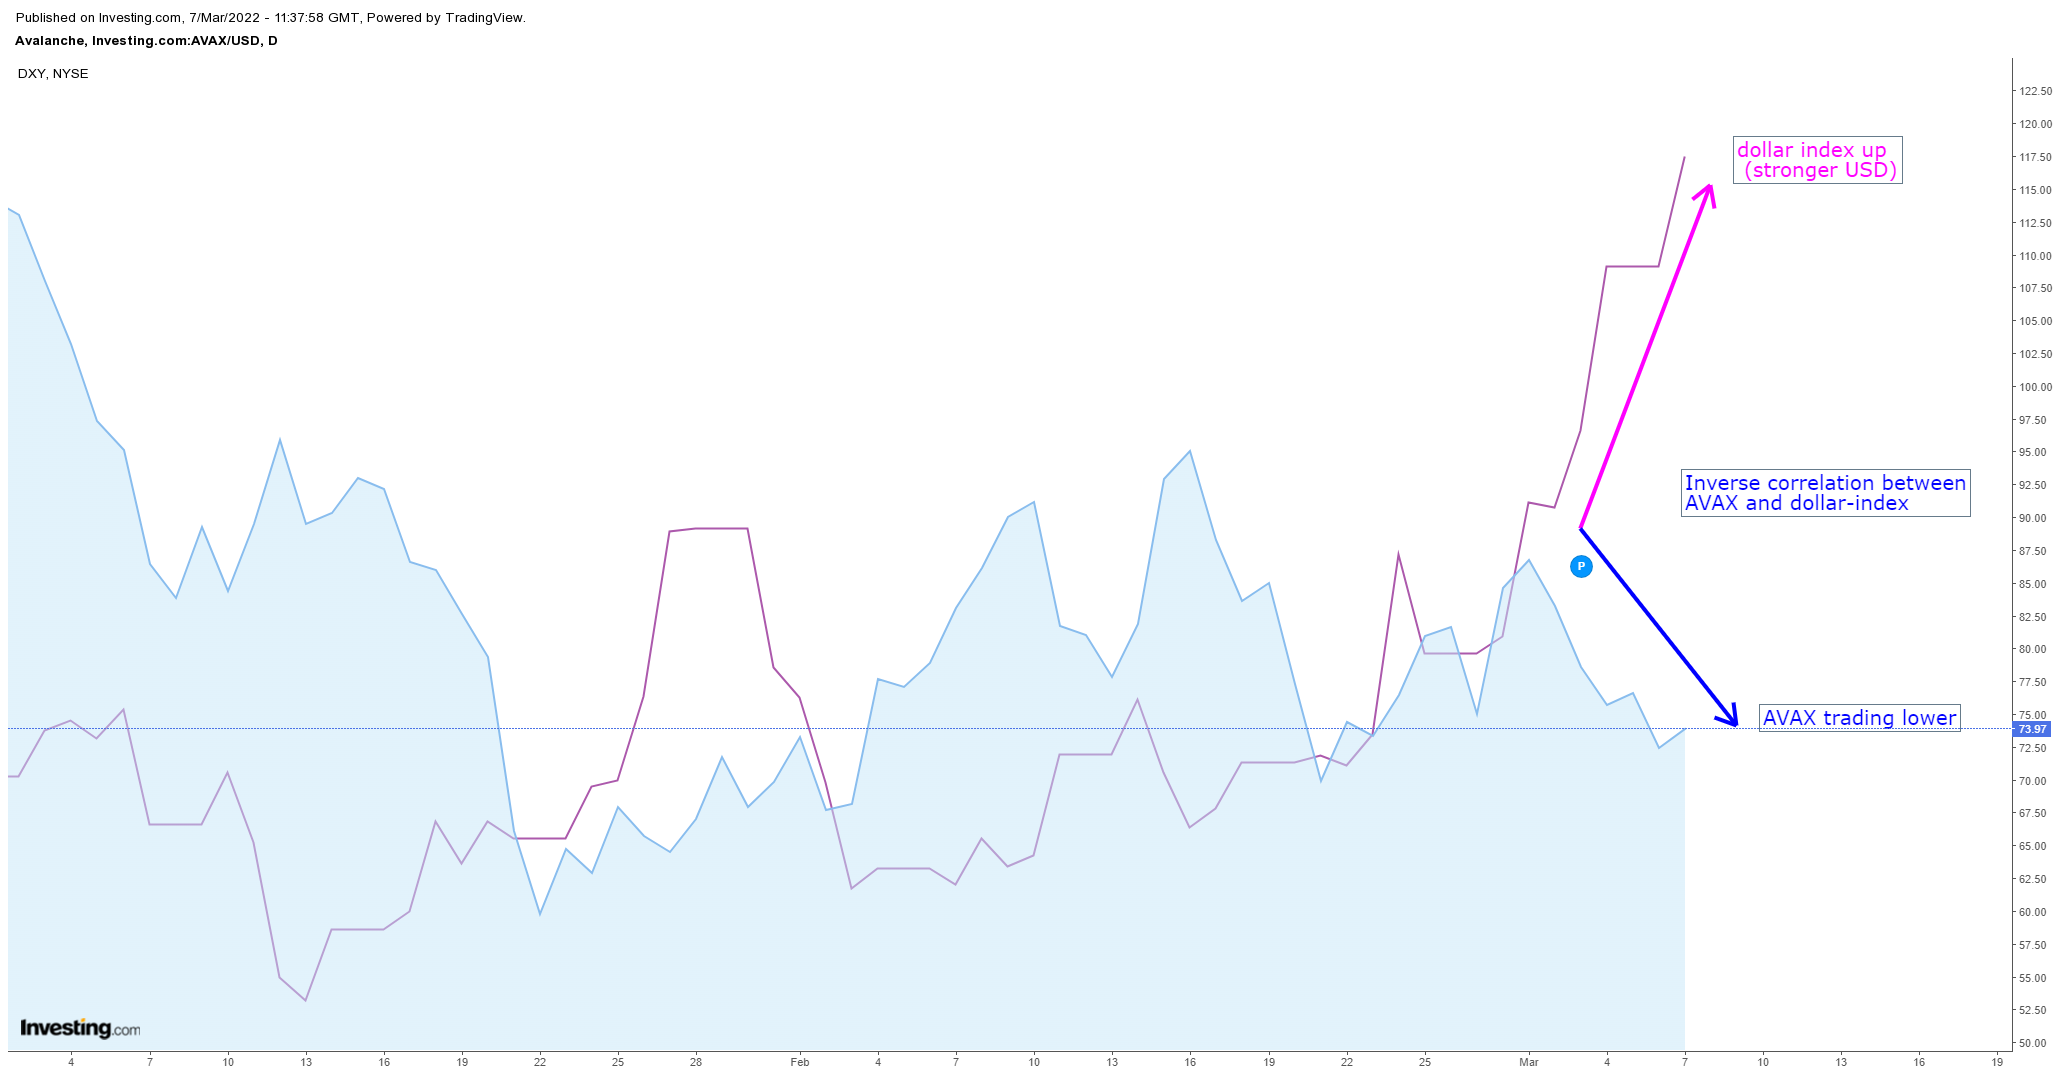
AVAX/USD compared with DXY daily chart
Levels mean AVAX price action could range between $76 to the upside and $70 to the downside. Expect with the dollar on the front foot, more dollar strength to be poured into the AVAX/USD cross and see AVAX dip towards either the monthly S1 at $66.47 or $61.62, a pivotal historical level. Should there be more dollar strength with EUR/USD going to 1.05 or even parity, expect AVAX price to dip towards $46, breaking below $50.
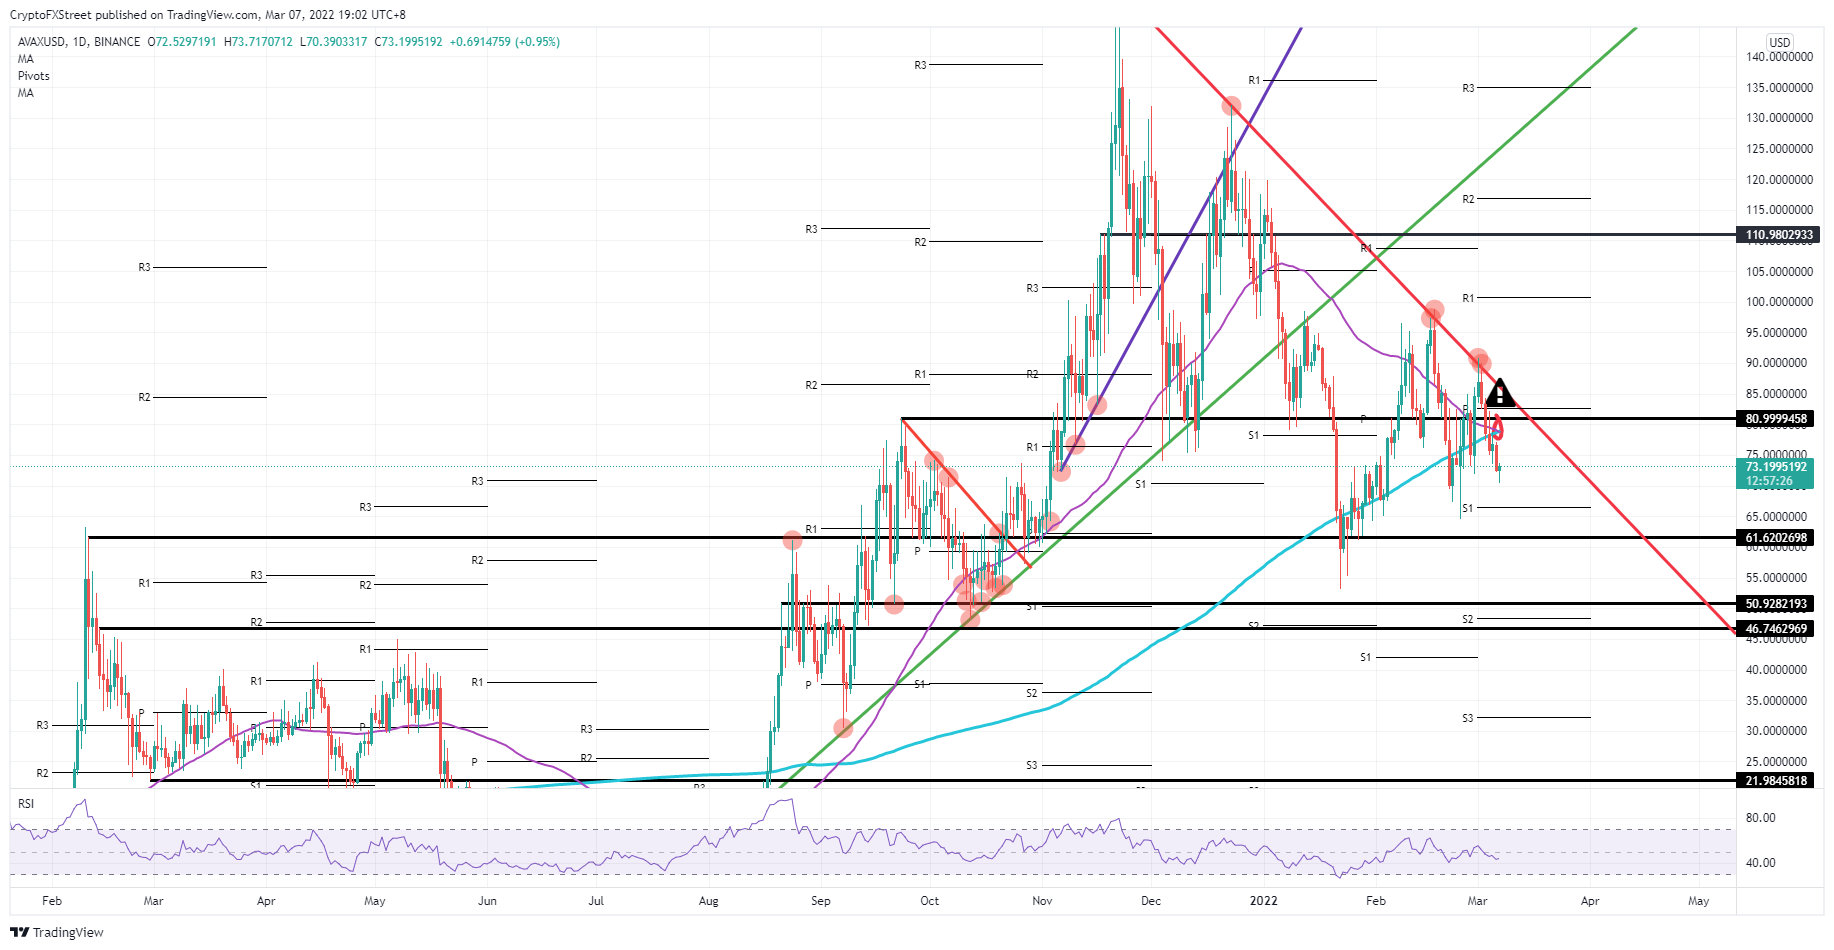
AVAX/USD daily chart
In the event of some relief headlines AVAX price could shift in direction, squeezing some short-term bears out of their positions and triggering a pullback to $81. The 200-day SMA and the 55-day SMA are in the way, so expect some early profit-taking when price hits those two, before reaching the actual $81-marker. Following that, the rally will probably have slowed down to such an extent that a break of the longer-term red descending trend line looks highly unlikely.
Information on these pages contains forward-looking statements that involve risks and uncertainties. Markets and instruments profiled on this page are for informational purposes only and should not in any way come across as a recommendation to buy or sell in these assets. You should do your own thorough research before making any investment decisions. FXStreet does not in any way guarantee that this information is free from mistakes, errors, or material misstatements. It also does not guarantee that this information is of a timely nature. Investing in Open Markets involves a great deal of risk, including the loss of all or a portion of your investment, as well as emotional distress. All risks, losses and costs associated with investing, including total loss of principal, are your responsibility. The views and opinions expressed in this article are those of the authors and do not necessarily reflect the official policy or position of FXStreet nor its advertisers. The author will not be held responsible for information that is found at the end of links posted on this page.
If not otherwise explicitly mentioned in the body of the article, at the time of writing, the author has no position in any stock mentioned in this article and no business relationship with any company mentioned. The author has not received compensation for writing this article, other than from FXStreet.
FXStreet and the author do not provide personalized recommendations. The author makes no representations as to the accuracy, completeness, or suitability of this information. FXStreet and the author will not be liable for any errors, omissions or any losses, injuries or damages arising from this information and its display or use. Errors and omissions excepted.
The author and FXStreet are not registered investment advisors and nothing in this article is intended to be investment advice.
Recommended Content
Editors’ Picks
Ripple's move above this key level could trigger nearly 50% rally for XRP
Ripple has overcome a critical resistance level and flipped into a support floor on the weekly time frame. This development happened while XRP tightly consolidated for roughly 250 days. Investors can expect XRP to kickstart a massive rally.
Optimism price outlook with nearly $90 million worth of OP tokens flooding markets on Friday
Optimism volatility has shrunk in the ours leading to the network’s cliff unlock. It joins the likes of dYdX and Sui, which have similar events on their calendars. As token unlocks are often considered bearish catalysts, investors should brace for a reaction after the event.
Top 3 Price Prediction Bitcoin, Ethereum, Ripple: Retail watches from the sidelines with a bias for shorts
Bitcoin could clear $73,777 peak as BTC bulls resurface. Ethereum might fall 10% before next leg up as ETH RSI teases with sell signal. XRP could lose $0.6000 threshold as Ripple bulls fail to show up.
Jito price could hit $6 as JTO coils up inside this bullish pattern
Jito price action shows a potential cup and handle formation. Based on theoretical measurement rules, a successful breakout could yield a 56% rally to $6.0. A breakdown of the $3.86 support level would create a lower low for JTO and invalidate the bullish thesis.
Bitcoin: BTC may have recovered, but is it out of the woods?
Bitcoin’s (BTC) upward momentum has shown a significant decline for the past two weeks or so. This development led to a bearish signal on the weekly and an uncertain outlook on the monthly.