|

AAVE Elliott Wave technical analysis [Video]

AAVE/USD Elliott Wave technical analysis

Function: Follow Trend.

Mode: Motive.

Structure: Impulse.

Position: Wave III.

Direction next higher degrees: Wave (III) of Impulse.

Wave cancel invalid level: 125.280.

Details: The five-wave likely goes up to test 482 Level.

AAVE/ U.S. dollar(AAVEUSD)Trading Strategy: Overview remains in an uptrend, with an impulsive rally, we are now in the fifth wave, which is incomplete, so the price is likely to continue to rise. Look for a rebound from the uptrend.

AAVE/ U.S. dollar(AAVEUSD)Technical Indicators: The price is above the MA200 indicating an uptrend, The Wave Oscillator is a Bullish Momentum.
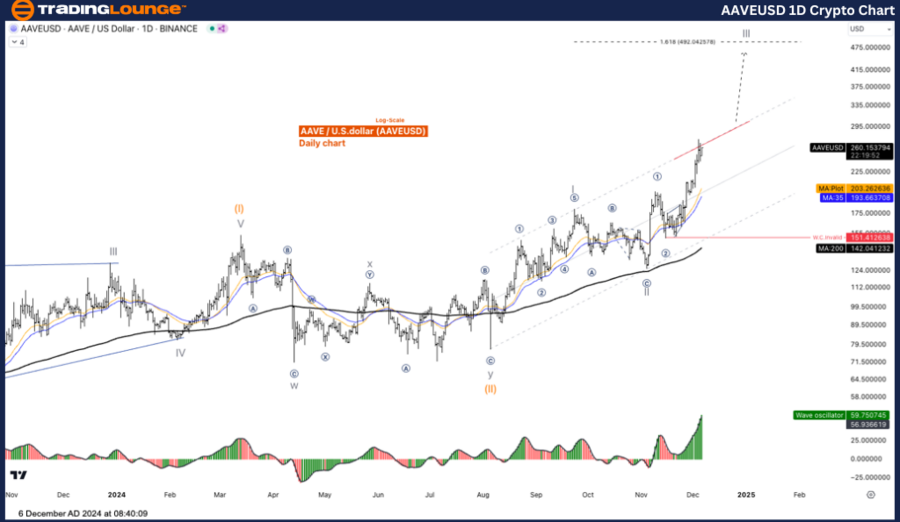
Chart

AAVE/USD Elliott Wave technical analysis

Function: Follow Trend.

Mode: Motive.

Structure: Impulse.

Position: Wave ((3)).

Direction Next higher Degrees: Wave III of Impulse.

Wave Cancel invalid Level: 125.280.

Details: The five-wave likely goes up to test 325 Level.

AAVE/ U.S. dollar (AAVE/USD) Trading Strategy: Overview remains in an uptrend, with an impulsive rally, we are now in the fifth wave, which is incomplete, so the price is likely to continue to rise. Look for a rebound from the uptrend.

AAVE/ U.S. dollar (AAVE/USD) Technical Indicators: The price is above the MA200 indicating an uptrend, The Wave Oscillator is a Bullish Momentum.
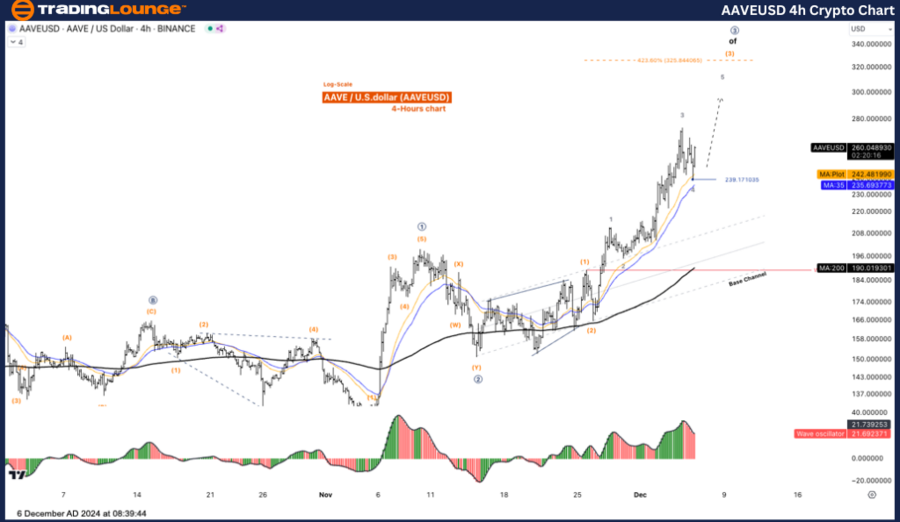
AAVE

AAVE Elliott Wave technical analysis [Video]

Author

Peter Mathers

Peter Mathers

TradingLounge

Peter Mathers started actively trading in 1982. He began his career at Hoei and Shoin, a Japanese futures trading company.


More from Peter Mathers
Share:

Editor's Picks

Injective: Mounting selling pressure threatens a long-term support trendline
Injective (INJ) extends losses below $7.50 at press time on Thursday, attracting sellers after the previous day’s 6% decline. The derivatives market shows a sell-side bias among traders, as market orders continue to sweep resting bids amid declining Open Interest in INJ futures. The technical outlook for INJ is mixed, with a key support trendline in focus.
Bitcoin under pressure as MSCI removes Strategy from global indexes, puts billions in fund flows at risk

Bitcoin remains under pressure, trading below $73,800 on Thursday after correcting over 1.5% so far this week. Bearish sentiment grew after news on Wednesday that MSCI, the global index provider, announced it will drop Strategy and other BTC-holding companies from global indexes, putting billions in fund flows at risk.

MSCI drops Strategy from indexes: What it means for Bitcoin

Strategy and Bitcoin came under fresh pressure late Wednesday after MSCI finalized its decision to remove the Bitcoin treasury company from its global indexes, raising concerns about potential selling pressure on MSTR shares and its future Bitcoin purchases.

Meme Coins Price Prediction: Dogecoin, Shiba Inu, and Pepe have yet to find a floor
Meme coins, including Dogecoin (DOGE), Shiba Inu (SHIB), and Pepe (PEPE), continue to attract sellers as the broader cryptocurrency market maintains a risk-off sentiment. Bitcoin (BTC) slipped below $75,000 this week amid hot US inflation reports, adding to last week’s uncertainty over tighter regulation as Democrats won the midterms.
Bitcoin: Bears tighten grip as BTC eyes fifth weekly loss
Bitcoin (BTC) remains under pressure, down over 3% this week, trading near $75,500 on Friday and heading for its fifth straight weekly loss. Persistent outflows from US-listed BTC spot Exchange Traded Funds (ETFs), a sharp sell-off in US technology stocks, and rising market liquidations are weighing on sentiment and limiting Crypto King’s recovery attempts.