A weekly close below $61 spells trouble for Solana
- Solana price is under pressure as it has 99 problems, but the dollar is not one.
- SOL price sees bears in the driving seat as the downtrend is nowhere near bottoming out.
- Expect to see another 70% decline possible in the coming weeks before the crypto bear market ends.

Solana (SOL) is nowhere near flagging that a bull run is underway. Every rally during the week has been a mere drop on a hot plate as bears were quick to match and break below the previous trading day's low. With such bearish sentiment, bulls will further stay sidelined and await a better level to enter, with $19 marked up as the turnaround signal.
SOL price could still lose 2/3rd of its value
Solana price is set close out the week below $61.44, which is on a weekly chart, a critical level going back to May of 2021. Together with the death cross, where the 55-day Simple Moving Average (SMA) is trading below the 200-day SMA, and the red descending trend line, the overall tone is still very much to the downside, with no turnaround anytime soon. Even though this downtrend is going into its seventh week of declines, the Relative Strength Index is still not oversold but is starting to even out a little bit.
SOL price could thus be seeing a turnaround in the coming weeks, but as mentioned with the RSI, more downturn is still possible. Expect SOL price that could still drop 70% with the price devaluating from $61.44 to $19.04. That last level could be the long-awaited floor that could setup SOL price for a rebound and pop back above $61.44 before rallying towards $90.23, where it will face a double top with the 55-day SMA just above a historic pivotal level.
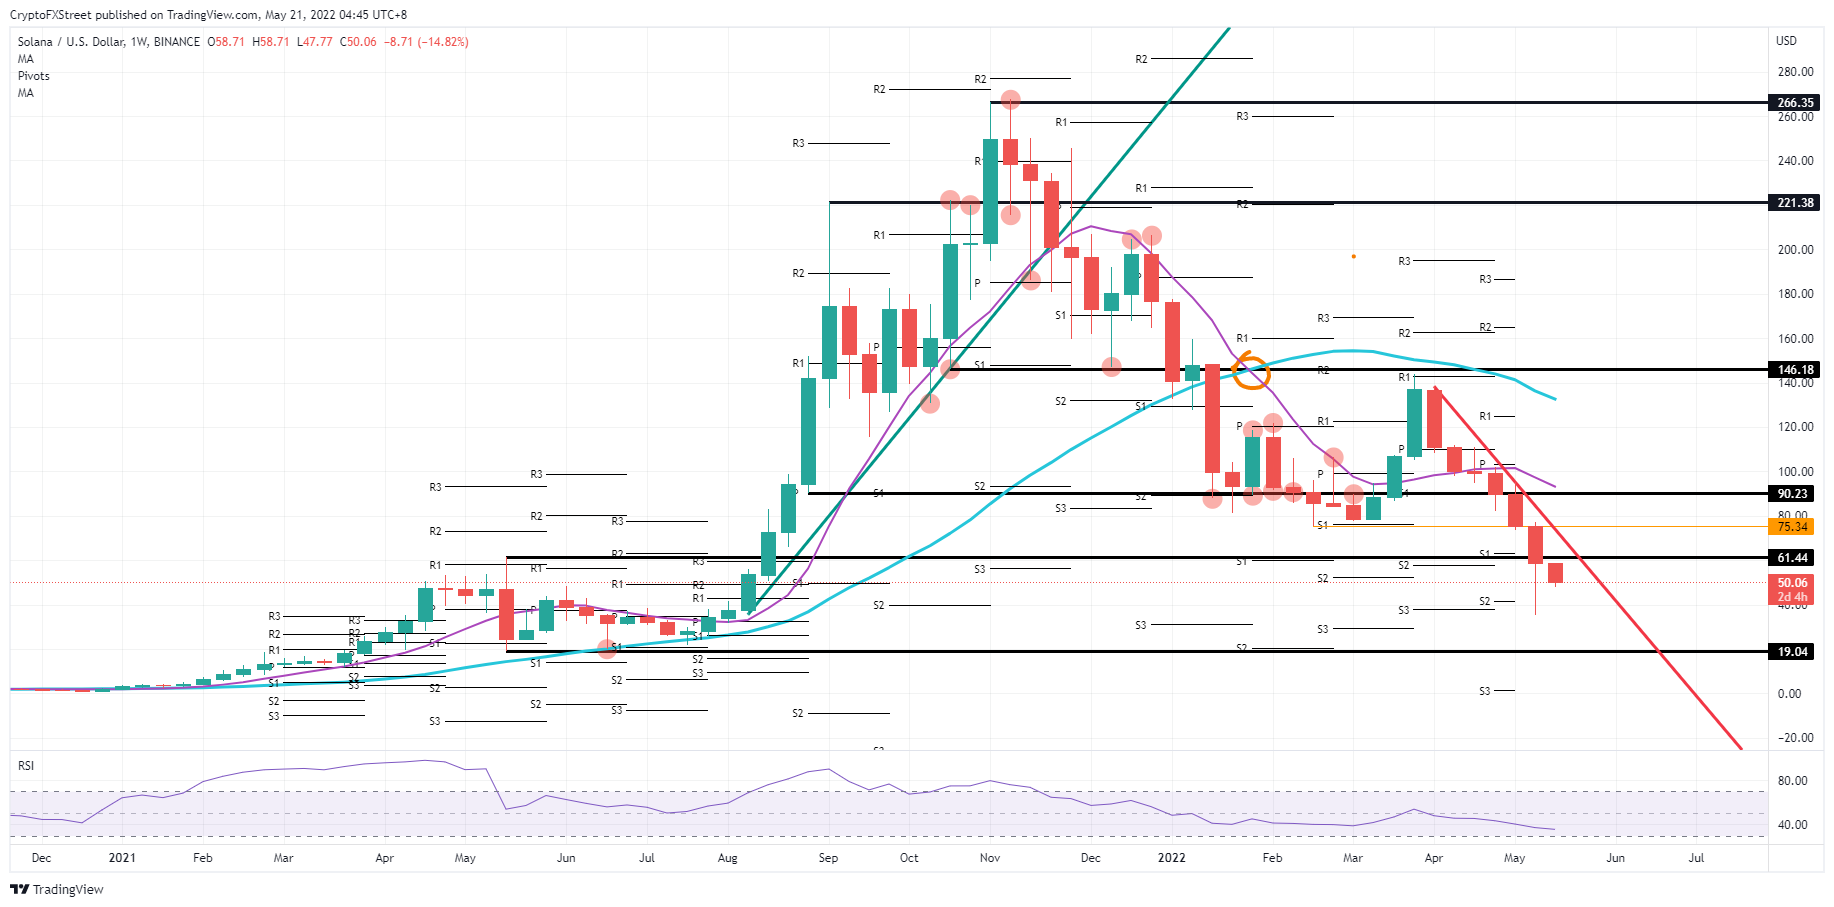
SOL/USD weekly chart
It might even be that it does not come to that, as the US dollar is set to close out the week weaker than before, with the DXY index dropping, some room for upside could be in the cards in the coming trading week. Should the eurodollar ease further above $1.06, expect to possibly see SOL price creep against that $61.44 for a squeeze and pop higher. A break above the red descending trend line could see a quicker rally and pierce through $90 towards an even $100.
Author

Filip Lagaart
FXStreet
Filip Lagaart is a former sales/trader with over 15 years of financial markets expertise under its belt.



