|

WTI Crude: The monthly chart is telling a bigger story

I’m sharing this monthly WTI chart not for hour‑to‑hour trading decisions, but to highlight the structural shift taking place in Oil. The long‑term picture has been building for months, and the market is finally starting to confirm it.

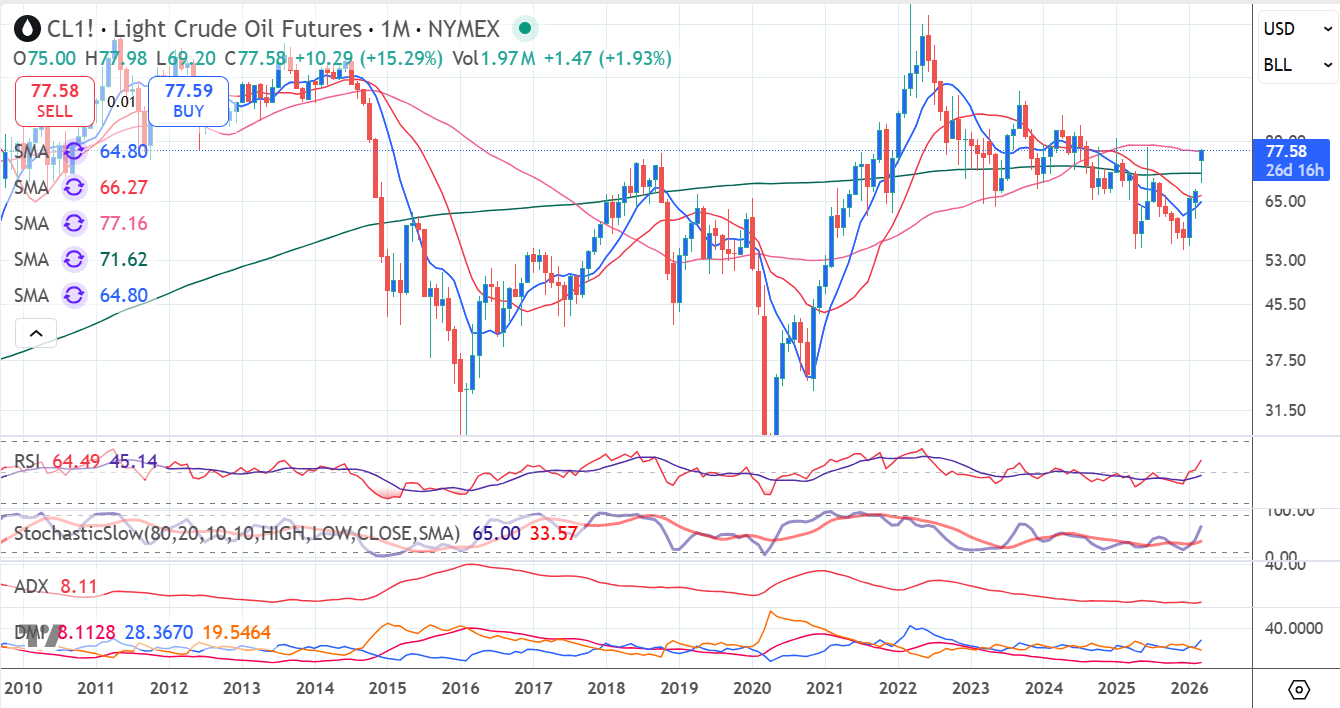
WTI completed a Double Bottom on the monthly timeframe between April and December 2025 — a formation I highlighted several weeks ago as a major bullish foundation. January then delivered a Reversal Month, signalling that the market was preparing for a broader move higher.

This week, that move finally accelerated.

Key technical developments

  • WTI has now broken above the 200‑month moving average, a significant long‑term trend indicator.
  • Price is currently edging above the 55‑month moving average at $77.16, reinforcing the shift in momentum.
  • From a structural perspective, Oil still has considerable room to the upside, with $88–$89 emerging as the broader long‑term target.

Why the 38.2% Fibonacci level matters

The 38.2% long‑term Fibonacci retracement sits at $81.70, and this level is critical.

Long‑term investors and funds use the monthly Fib structure for entry and exit clarity, especially following a completed Double Bottom.

I expect WTI to gravitate toward $81.70 in the coming weeks.

This is where:

  • Profit‑taking will naturally emerge.
  • Counter‑trend sellers will step in.
  • Momentum will be tested.

A clean break above this level would strengthen the case for the $88–$89 target zone.

Short‑term considerations

Despite the strong momentum:

There is an open gap at $67.85, and markets rarely ignore gaps forever.

Overbought/oversold indicators should be monitored closely.

The $80.00 psychological level will act as a natural magnet and initial cap — traders love round numbers, and positioning often clusters around them.

Bottom line

The long‑term structure in WTI is turning decisively higher.

The Double Bottom, the Reversal Month, and the break above major monthly moving averages all point to a market transitioning into a new phase.

WTI

Author

Carol Harmer

Carol Harmer

Charmer Trading

Carol Harmer has over 39 years experience of analysing and trading the world's markets and is undoubtedly one of the most respected technical trader in the world today.

More from Carol Harmer
Share:

Editor's Picks

EUR/USD rebounds from session lows, stays below 1.1650

EUR/USD is recovers modestly from session lows but remains in the red below 1.1650 in European trading on Thursday. The pair faces headwinds from a renewed uptick in the US Dollar amid a negative shift in risk sentiment. Surging energy prices due to the Middle East war keep the bearish pressure intact on the Euro. The US Jobless Claims data are next of note. 

GBP/USD stays weak near 1.3350 amid UK stagflation risks

GBP/USD sticks to losses near 1.3350 in the European session on Thursday. The Pound Sterling loses ground amid fears that the United Kingdom economy could face stagflation risks due to higher energy prices, while the US Dollar attracts fresh havem demand ahead of the US Jobless Claims data. 

Gold climbs near $5,200 as Iran war fuels safe-haven demand

Gold price extends its gains for the second successive session on Thursday as traders seek safety amid the ongoing war in the Middle East. US and Israeli strikes across Iranian territory and widespread Iranian missile and drone retaliation across the Middle East, including attacks on regional targets and military sites, prolong the crisis and its impact.

Three reasons to be bearish on Bitcoin

Bitcoin is holding up well taking into account the uncertainty stemming from the Middle East. Despite this week’s rally, the long-term outlook remains bearish. Here are three reasons why I think the storm for the largest cryptocurrency isn't over yet.

FX alert: When Energy still writes the macro script the Dollar holds the pen

The market is quietly sliding back into the trade nobody wanted to own, but everyone now has to respect again. The no quick off-ramp trade. Yesterday’s bounce in risk assets already looks less like a turning point and more like a classic relief rally in a market that briefly inhaled before realizing the room was still on fire.

Cardano Price Analysis: Approaches key trendline amid bearish sentiment

Cardano (ADA) price is approaching its descending trendline around $0.28 at the time of writing, set to shape the next directional move. The derivatives metrics paint a bearish picture, with ADA’s Open Interest continuing to fall and short bets rising among traders.