USD/JPY analysis: upside capped by steady yields

USD/JPY Current price: 111.18
- USD/JPY contained by selling interest around the 111.40/50 price zone.
- Bearish trend to resume on a break below the 110.70/80 area, the immediate support.
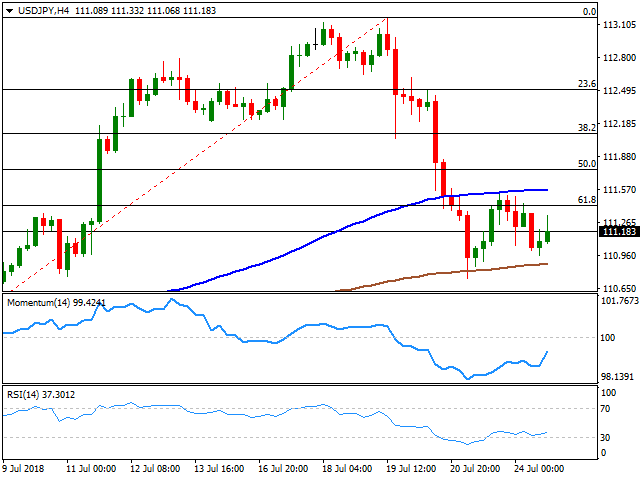
The yen remained strong, appreciating against its American rival, although with the USD/JPY pair confined to its Monday's range. The preliminary July Nikkei Manufacturing PMI resulted at 51.6, missing market's expectations of 53.2 and below June's 53.0, while the country's leading index was revised to a 6-month high of 106.9 in May. The coincident index, however, that reflects the current economic activity dropped to 116.8 in May from 117.5 in the previous month. Keeping the upside limited in the pair were US Treasury yields, which remained near Monday's highs, unable to extend their recent rallies. The pair continues consolidating below the 61.8% retracement of its 110.34/113.71 daily rally at around 111.40, with an attempt to broke above it being quickly reverted. In the 4 hours chart, the 100 SMA stands flat a few pips above the mentioned Fibonacci level, while the 200 SMA continues providing a short-term support at around 110.80. The Momentum indicator in the mentioned chart recovers within negative levels, but the RSI lacks directional strength around 36, all of which limits chances of a steeper advance, at last as long as selling interest keeps capping advances in the 111.40/50 region. Below the 110.70/80 price zone, the pair will likely resume its decline, with scope then to test the 110.00 level.
Support levels: 110.75 110.35 110.00
Resistance levels: 111.50 111.85 112.20
Author

Valeria Bednarik
FXStreet
Valeria Bednarik was born and lives in Buenos Aires, Argentina. Her passion for math and numbers pushed her into studying economics in her younger years.


