USD/CAD Weekly Forecast: Weakness may be a temporary condition
- Canadian dollar gains 0.6% on the week despite WTI drop of 7.5%.
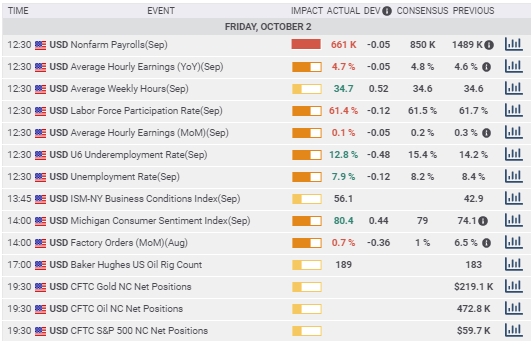
- US dollar awaits Congressional stimulus package after mixed NFP report.
- Canadian Net Employment Change and Unemployment Rate due on Friday.
- COVID-19 diagnosis of President Trump deals a wild card in the US election.
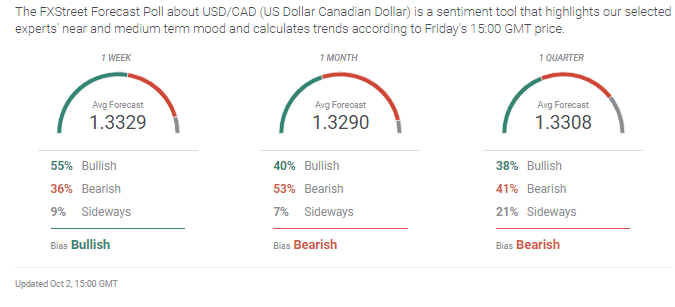
- FXStreet Forecast Poll moves sideways out to one quarter.

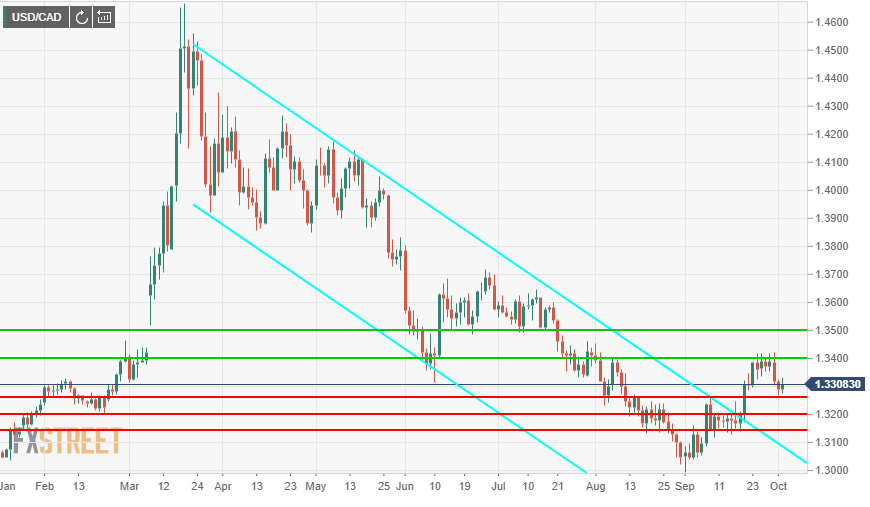
The Canadian dollar rose on the week but its finish at 1.3308 lacked direction and was in line with the original break of the pandemic downtrend two weeks ago.

In the US the mixed September Nonfarm Payrolls report was ignored but the diagnosis of President Donald Trump with COVID-19 upset election calculations. The Congressional attempt to fashion a second pandemic stimulus package has the greatest relevance for the US dollar and equities. A new package appears to be necessary for the recovery to remain track but its completion has been stymied by election politics as the Democrats and Republicans jockey for a November advantage.
The two-week consolidation in the USD/CAD highlights the technical origin of the September 21 break. The negative US dollar scenario had reached a natural limit but it was not transposed into a sudden strong affinity for the greenback by a change in economic fundamentals.
USD/CAD outlook
The USD/CAD awaits a change in circumstances. A number of factors, economic and political, are competing for attention.
In Europe, the UK and parts of the United States COVID-19 cases are again rising but the numbers and the potential for reimposing economic restrictions have not brought on a safety surge to the US dollar. American economic statistics have generally been good but the linchpin of the labor economy seems to be weakening and with the stimulus blocked so far in Congress the continuation of the recovery is increasingly doubtful.
Canada’s resource-dependent economy needs a global recovery and a rise in commodity prices to thrive but neither is on the horizon.
Until the economic picture becomes clear neither side of the USD/CAD will be able to secure precedence.
The US presidential election was dramatically upended by the COVID-19 of President Trump and several top Republican legislators. In the febrile and emotional atmosphere of the campaign, the political impact may depend on the progress of the illness in one individual, the President, which makes its uncertainty immeasurably greater.
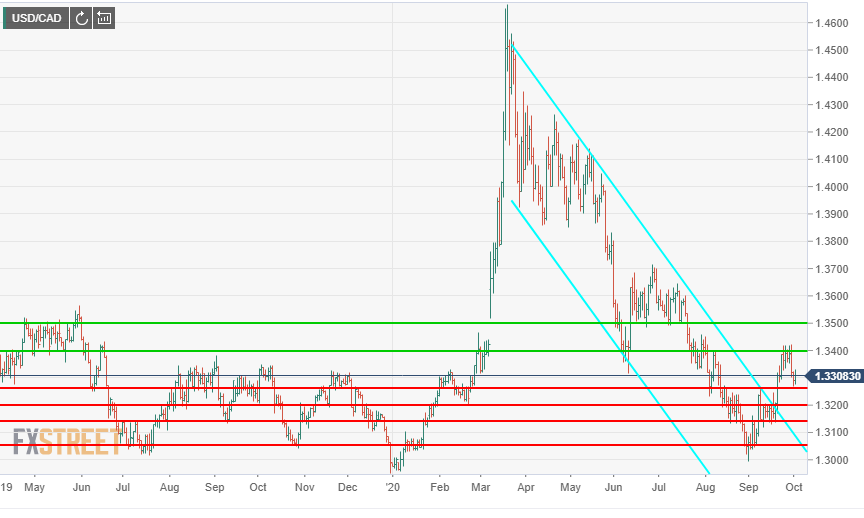
Given the indecision in economic and political fundamentals, technical aspects take on greater significance. Support at 1.3265, 1.3200 and 1.3145 and 1.3050 is well established with basis in August and September and the nine months from July 2019 to February this year.
Resistance levels at 1.3400 and 1.3500 have a lesser pedigree as they stem from pricing during the pandemic volatility and the first half of 2019.
Canada and US statistics September 28-October 2
Canadian statistics had little market impact this week as all but one were for August.
The Raw Material Price Index (prices paid) which tracks prices paid by manufacturers rose 3.2% in August after July’s 3% gain. Industrial Product Price which gauges the cost of commodities produced in Canada rose 0.3% in August, less than half the 0.7% gain in July.
Canadian GDP expanded 3% in July following the June 6.5% increase. Building Permits climbed 1.7% in August reversing the unexpected 1.6% decline in July.
Markit’s September PMI at 56 was up from 55.1 in August and the highest since August 2018.
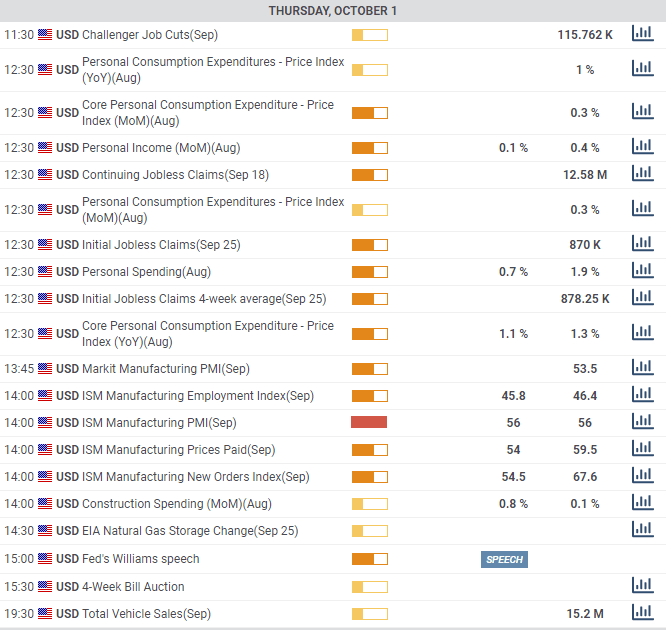
In the US the data, except for the NFP report, was generally good. The Dallas Fed Manufacturing Business Index, a regional assessment of the factory sector rose to 13.8 in September from 9 for the best reading in 22 months and miles ahead of the lockdown low of -74 in April.
The economic collapse in the second quarter was slightly less deep with GDP revised to -31.4% from -31.7%. Pending Home Sales rose 8.8% in August almost three times the 3.2% prediction.
Personal Income fell 2.7% in August as more people returned to work and Personal Spending rose 1% after July’s 1.5% increase.
Initial Jobless Claims were 837,000 in the September 25 week a bit better than predicted but the four-week moving average at 867,250 indicates that jobs are still being lost as business shuttered or at half-speed continue to fail.
The ISM Manufacturing Index was 55.4 in September, little changed from 56 in August and the New Orders Index registered its fourth month of strong growth at 60.2. Nevertheless, employment continued to drag with the index at 49.6 just under the 50 mark for expansion.
Payrolls as noted above missed expectations at 661,000 but the addition to private jobs of 877,000 was above the overall forecast, and reduced by the loss of 216,000 government workers including 34,000 Census takers. The government reductions are largely due to continuing pandemic related closures around the country. Unemployment fell to 7.9% from 8.4% and the underemployment rate, considered by many economists to be a better measure of joblessness, dropped to 12.8% from 14.2%.
Consumer Confidence in September rose to 101.8 in September from 89.6 in the Conference Board Survey. It was the largest single month jump in 17 years.
Canada statistics September 28-October 2
 US statistics September 28-October 2

 Canada statistics October 5-October 9
International Merchandise Trade Balance for August is expected to be -C$2.5 billion little changed from the July total of –C$2.45 billion.
Ivey Purchasing Managers’ Index for September has possible market impact. The August score of 67.8 was just down from July’s post-pandemic panic and 27-month high of 68.5.
Housing starts in September will give an up-to-date view on the residential construction market. The projected 220,000 annualized rate would be lower than August’s 262,400 and July’s 245,400 but comparable with the market in 2019.
Net Change in Employment for September is expected to add 230,200 jobs after increasing 245,800 in August and 418,500 in July. Unemployment is forecast to drop 0.1% to 10.1% and the Participation Rate to remain unchanged at 61.4%. Wages rose 6% on the year in August. This employment report has the greatest potential for market response. A good report will support the Canadian dollar and the reverse.
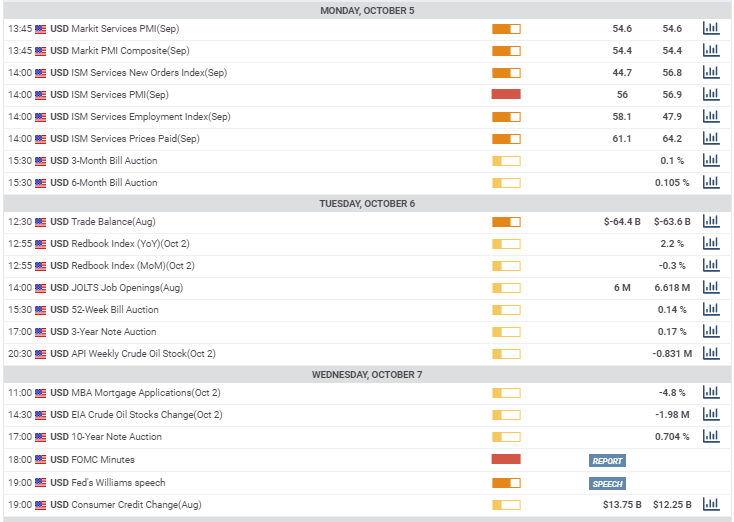
 US statistics October 5-October 9
The ISM Services Purchasing Managers' Index for September is forecast to moderate to 56 from 56.9. The New Orders Index is expected to drop below expansion to 44.7 from 56.8 and the Employment Index is projected to climb to 58.1 from 47.9.
This information has the potential for market movement. The service sector is about 85% of the US economy and an appreciably better or worse report will reflect to the dollar in the same fashion.
Initial Jobless Claims will be a second focus this week with a stronger or weaker number having a similar effect on the dollar.
 USD/CAD technical outlook
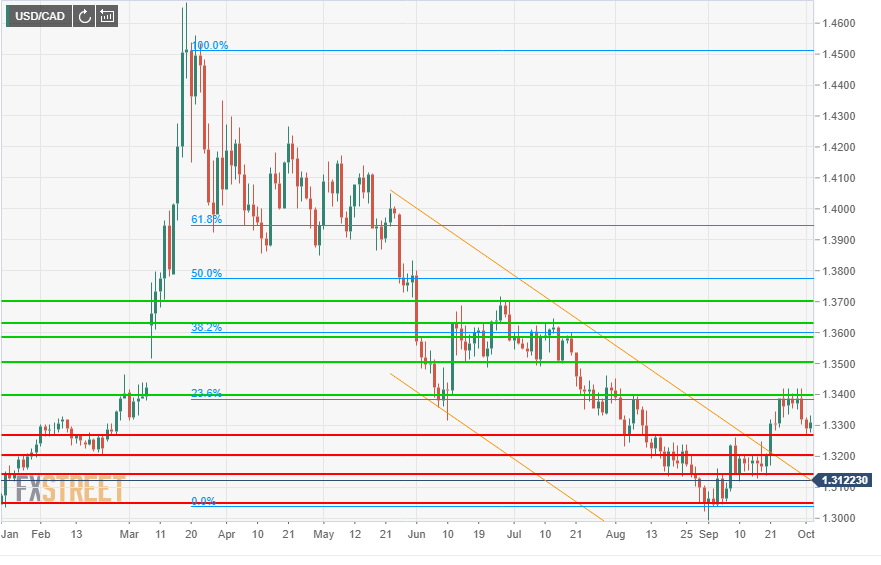
Support is generally stronger having been extensively tested in August and September but the 1.3400 line is key to opening the ascent. If that can be breached then the next important line is not until 1.3500. The mild technical bias higher is seconded by the brewing US dollar safety trade and the pending stimulus package from Congress.
Resistance: 1.3400; 1.3500; 1.3585; 1.3630; 1.3700
Support: 1.3265; 1.3200; 1.3145; 1.3050
USD/CAD Forecast Poll
Premium
You have reached your limit of 3 free articles for this month.
Start your subscription and get access to all our original articles.
Author

Joseph Trevisani
FXStreet
Joseph Trevisani began his thirty-year career in the financial markets at Credit Suisse in New York and Singapore where he worked for 12 years as an interbank currency trader and trading desk manager.


