|

The Chart of the Week: USD/CAD has complied with the medium term bearish bias

  • USD/CAD bears are in playtesting critical support territory
  • On a break of the head & shoulders, the downside is all to play for.

As per prior analysis, USD/CAD is shaping up to be a medium-term play following a classic visit and retest of prior highs fortifying a downside bias as follows:

USD/CAD daily chart, prior analysis

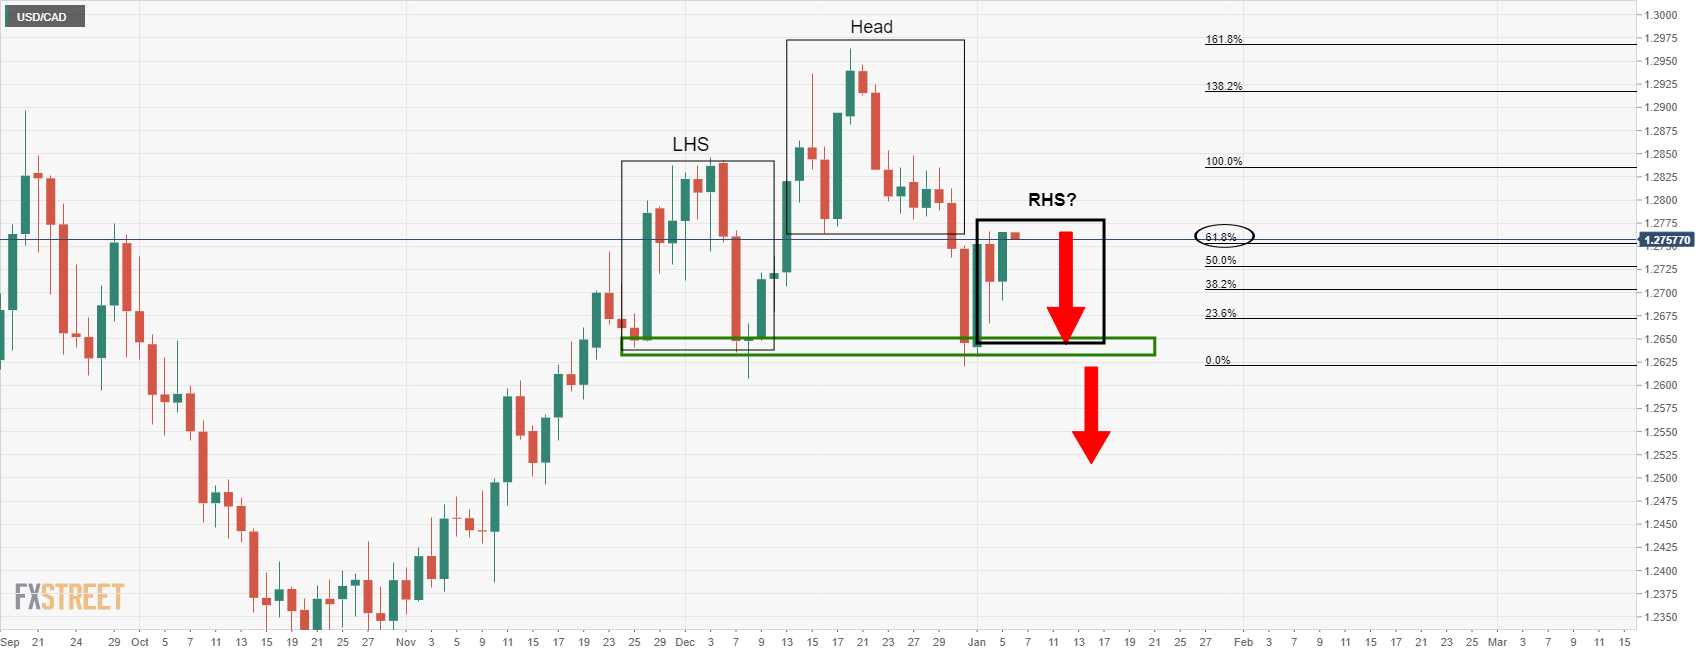
As illustrated above, the head and shoulders were in the making...

In the prior sessions, the price has mitigated the imbalance of price and subsequently, the bears have moved in and driven the price into daily support. This makes for a compelling scenario. 
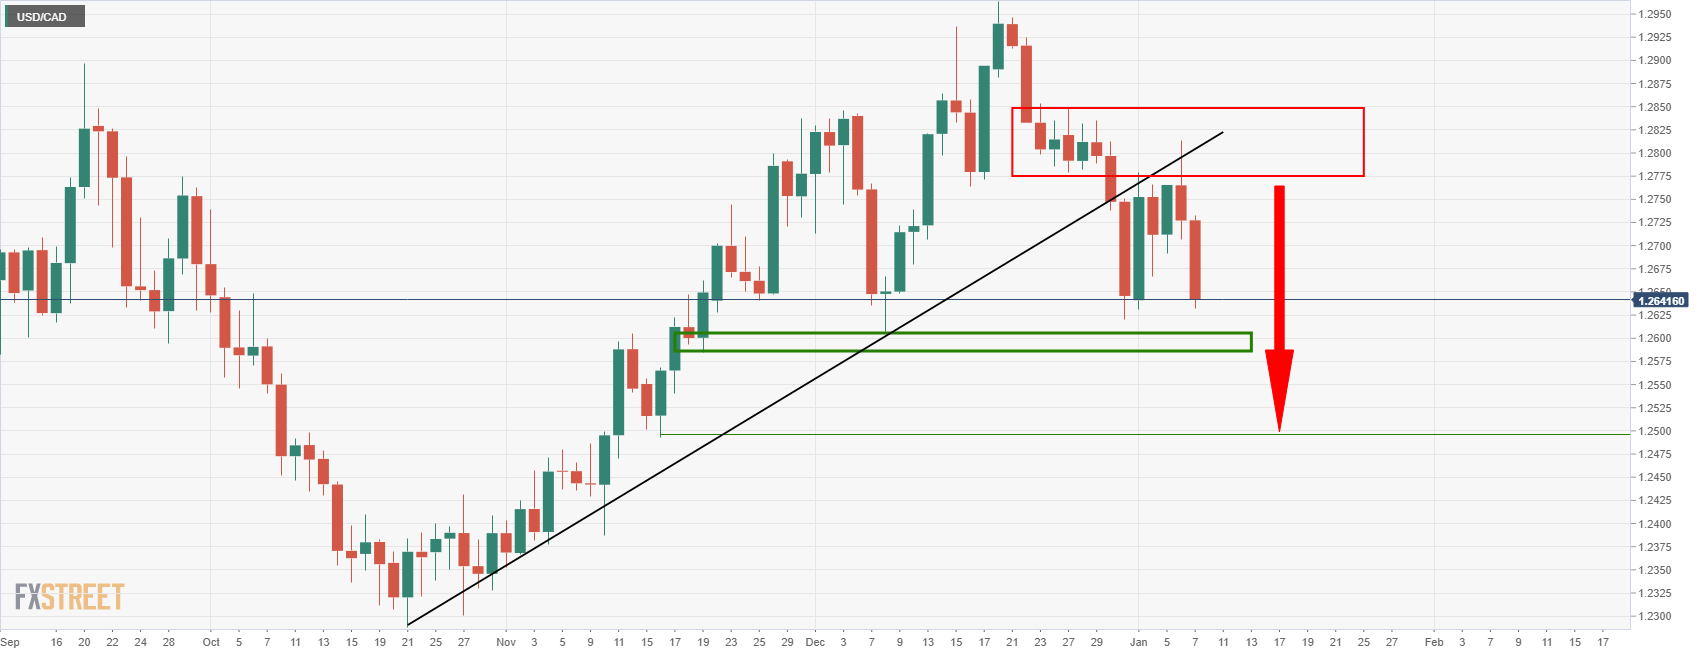
USD/CAD H4 chart

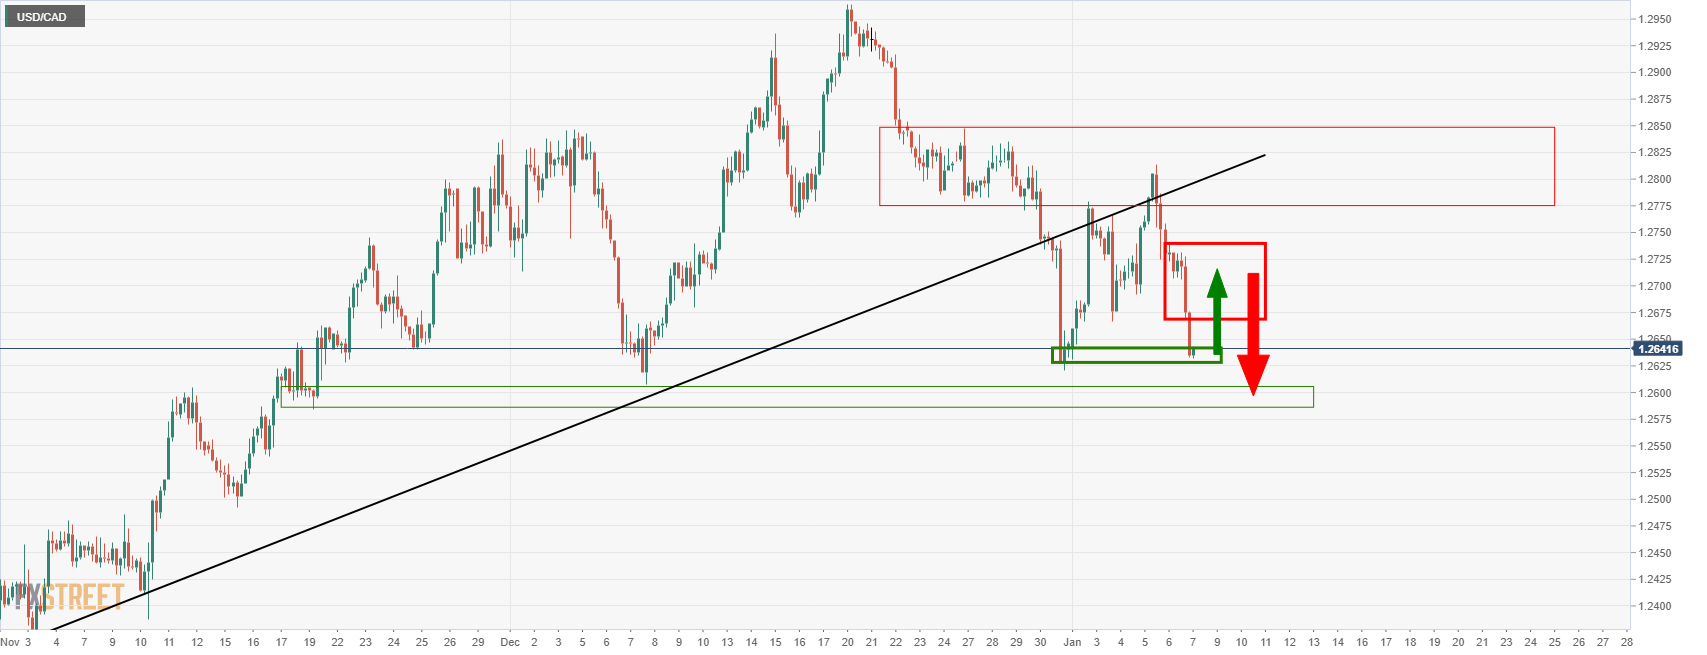
With a bias to the downside below the counter trendline, we have a bearish structure. above the local support. The price would be expected to move into the 1.27 area prior to a sell-off.

USD/CAD H1 chart

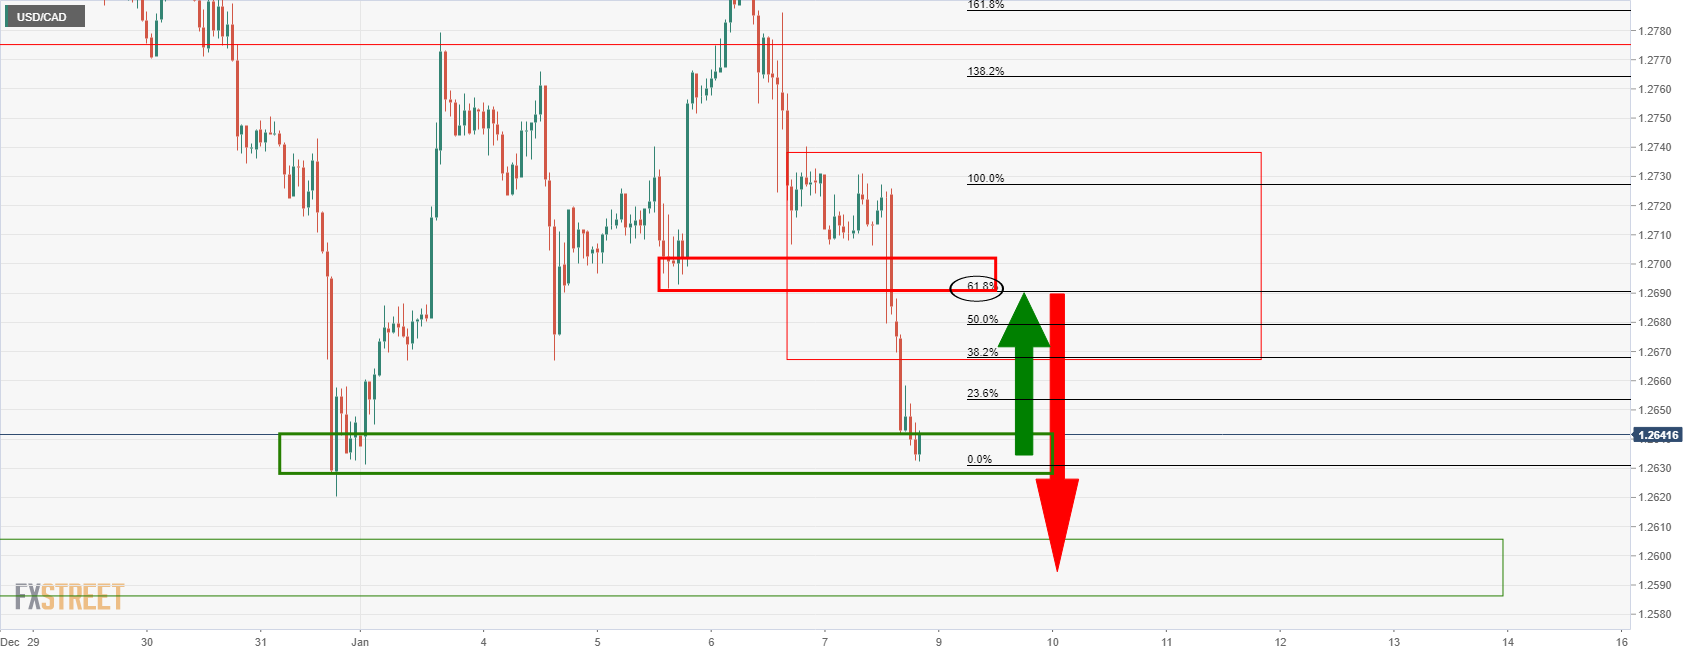
From a shorter-term perspective, the 61.8% Fibo on the hourly char aligns within a prior structure that could well draw in the price prior to a downside correction. The bearish playbook also rhymes with positioning considering net speculators’ CAD net positions remain in positive ground for several straight weeks following the hawkish tone of the BoC.

Premium

You have reached your limit of 3 free articles for this month.

Start your subscription and get access to all our original articles.

Subscribe to PremiumSign In

Author

Ross J Burland

Ross J Burland, born in England, UK, is a sportsman at heart. He played Rugby and Judo for his county, Kent and the South East of England Rugby team.

More from Ross J Burland
Share:

Markets move fast. We move first.

Orange Juice Newsletter brings you expert driven insights - not headlines. Every day on your inbox.

By subscribing you agree to our Terms and conditions.

Editor's Picks

EUR/USD trades with negative bias around 1.1730 amid recovering USD; downside seems limited

The EUR/USD pair kicks off the new week on a softer note, though it remains within striking distance of the highest level since early October, touched last Thursday. Spot prices currently trade around the 1.1730 region, down less than 0.10% for the day.

GBP/USD holds steady above mid-1.3300s as traders await key data and BoE this week

The GBP/USD pair remains on the defensive during the Asian session on Monday, though it lacks bearish conviction and holds above the 200-day Simple Moving Average pivotal support. Spot prices currently trade around the 1.3360 region, nearly unchanged for the day.

Gold retains bullish bias ahead of this week’s key US macro releases

Gold attracts buyers for the fifth straight day and climbs to the $4,330 region during the Asian session on Monday. The commodity remains well within striking distance of its highest level since October 21, touched on Friday, and seems poised to appreciate further amid a supportive fundamental backdrop. 

Solana consolidates as spot ETF inflows near $1 billion signal institutional dip-buying

Solana price hovers above $131 at the time of writing on Monday, nearing the upper boundary of a falling wedge pattern, awaiting a decisive breakout. On the institutional side, demand for spot Solana Exchange-Traded Funds remained firm, pushing total assets under management to nearly $1 billion since launch. 

Big week ends with big doubts

The S&P 500 continued to push higher yesterday as the US 2-year yield wavered around the 3.50% mark following a Federal Reserve (Fed) rate cut earlier this week that was ultimately perceived as not that hawkish after all. The cut is especially boosting the non-tech pockets of the market.

Aave Price Forecast: AAVE primed for breakout as bullish signals strengthen

Aave (AAVE) price is trading above $204 at the time of writing on Friday and approaching the upper boundary of its descending parallel channel; a breakout from this structure would favor the bulls.