USD/CAD Price Analysis: Bears get their discounts, now need to break critical 4-hour support
- USD/CAD is in the hands of the bears and eyes are on the daily H&S taking shape.
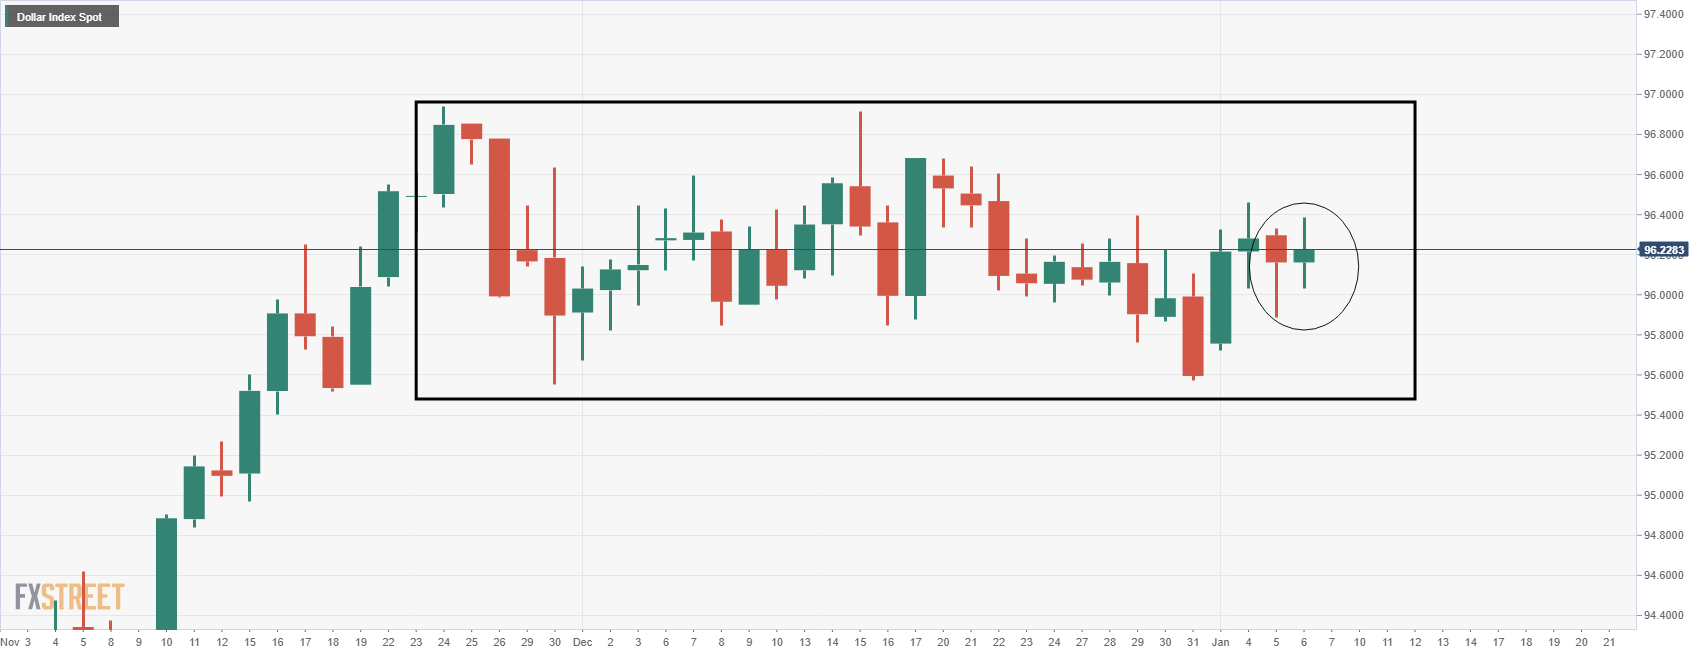
- The US dollar remains consolidated despite hawkish FOMC minutes.

The US dollar was making life difficult for the impatient bears midweek following a firmly hawkish confirmation at the Federal Reserve on the back of the Federal Open Market Committee minutes. However, following a brief rally in the greenback, the market has rebalanced and the US dollar is struggling to stay green on the day within familiar ranges as follows:
This has enabled the bears to take back control in USD/CAD and as per yesterday's analysis, USD/CAD Price Analysis: Bears line up for their discounts, as a case for a bearish breakout can still be made. The following illustrates the market structure from a daily and 4-hour bearish perspective:
USD/CAD, prior analysis
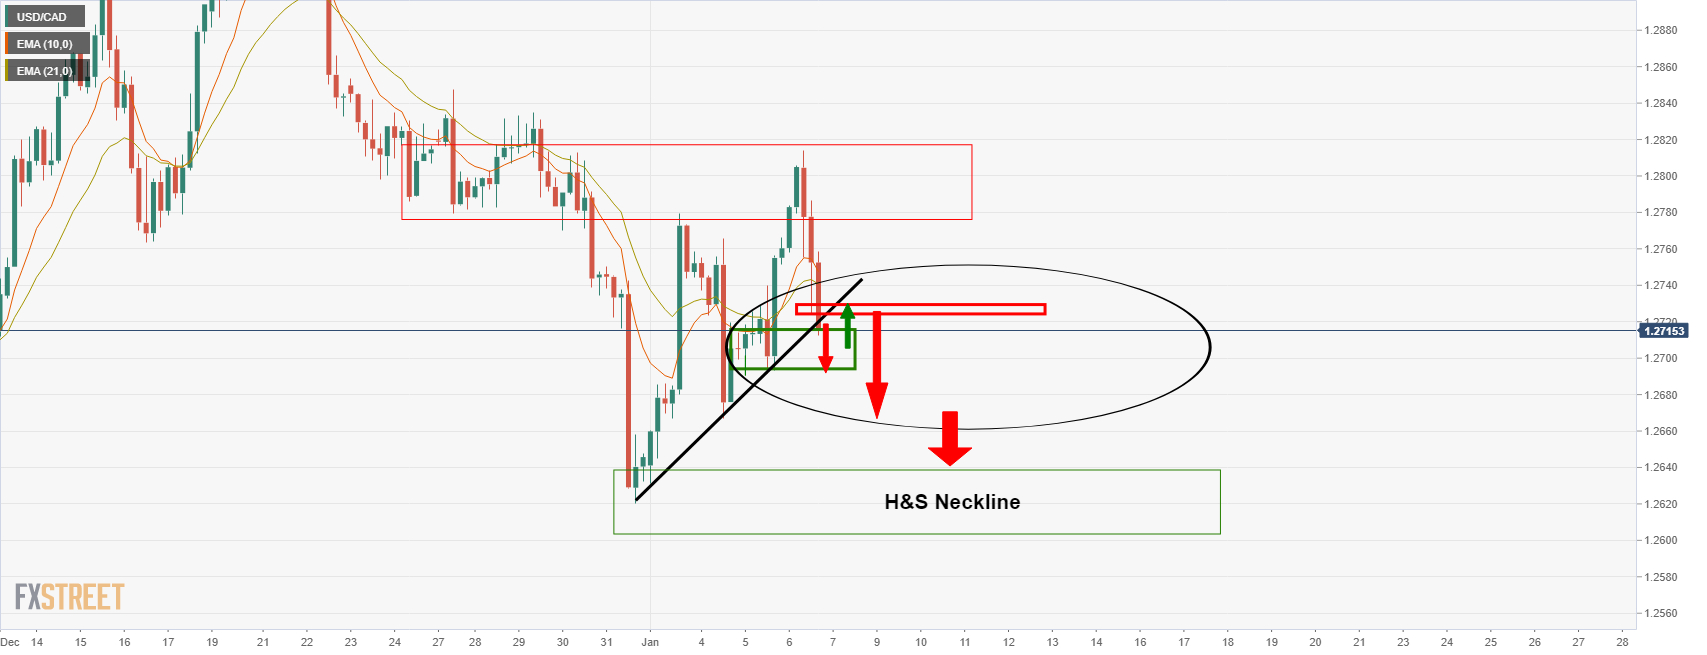
USD/CAD H&S formation in the making;
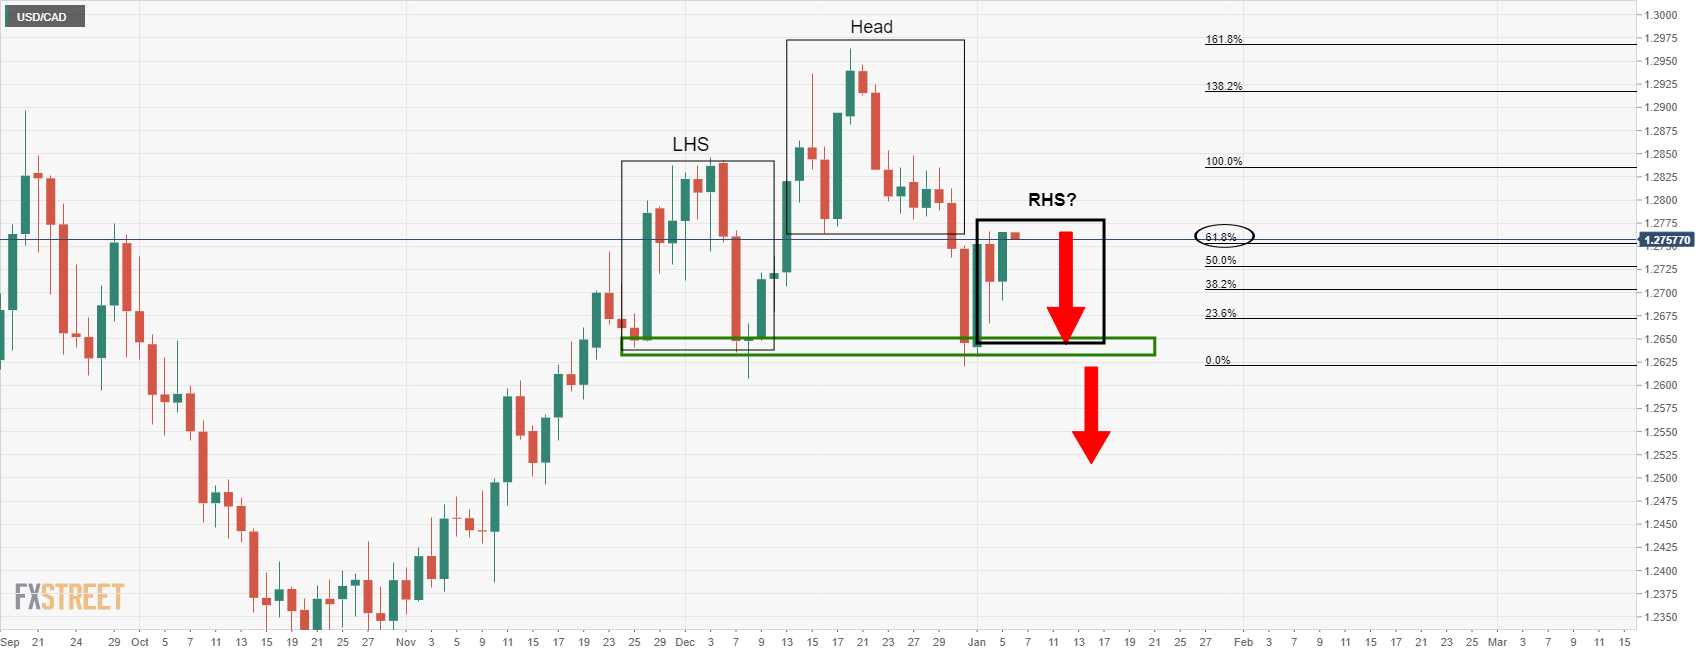
The formation of the head and shoulders pattern was explained as being a potential topping formation for the days ahead.
So, the price would be expected to run significantly lower on a break and retest of the neckline near 1.2630.
1.2520 will be earmarked as per the dynamic trendline support:
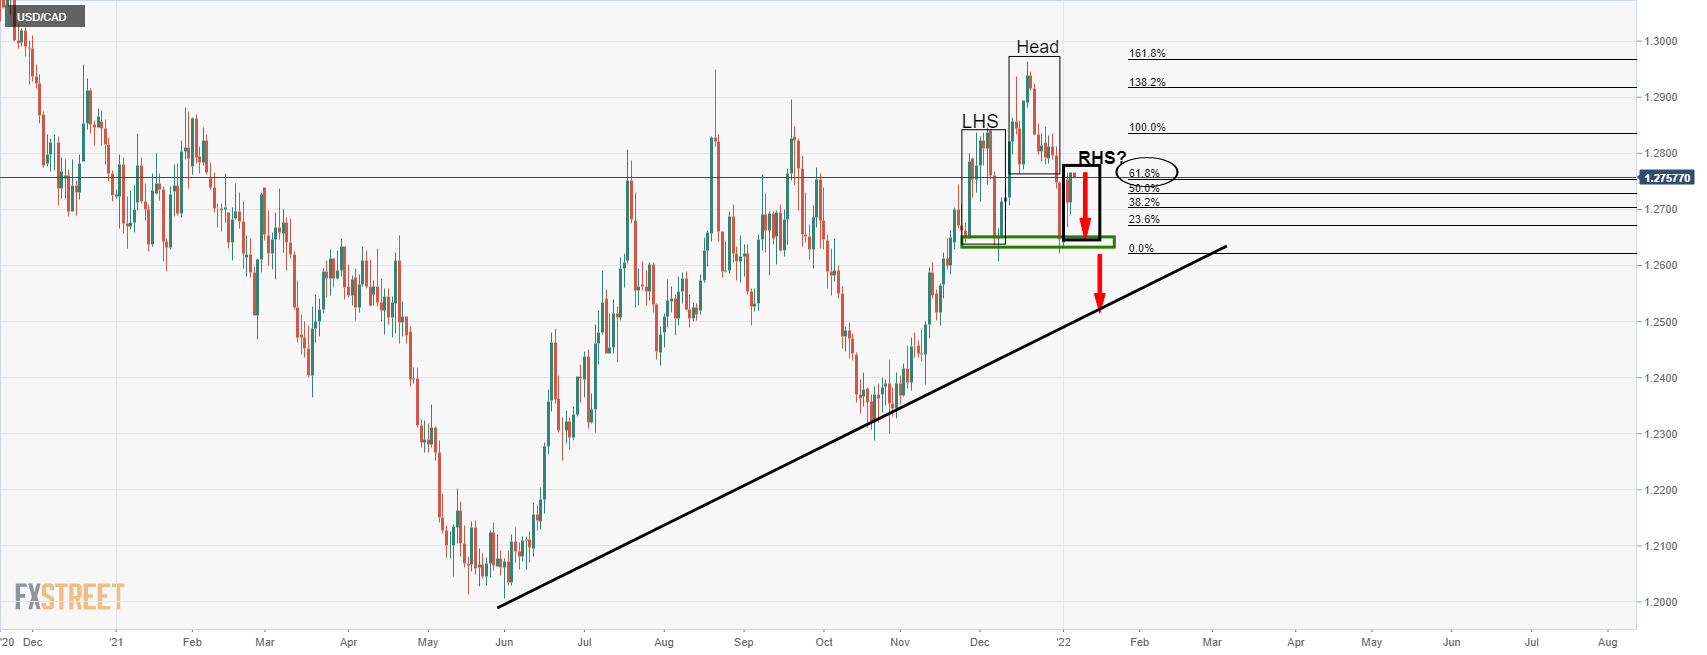
Bearish structure playing out
For this to play out, we wanted to see a down move in the US dollar, despite the hawkish Federal Reserve minutes.
From a 4-hour perspective, we were looking for a move as follows as illustrated in the prior analysis:
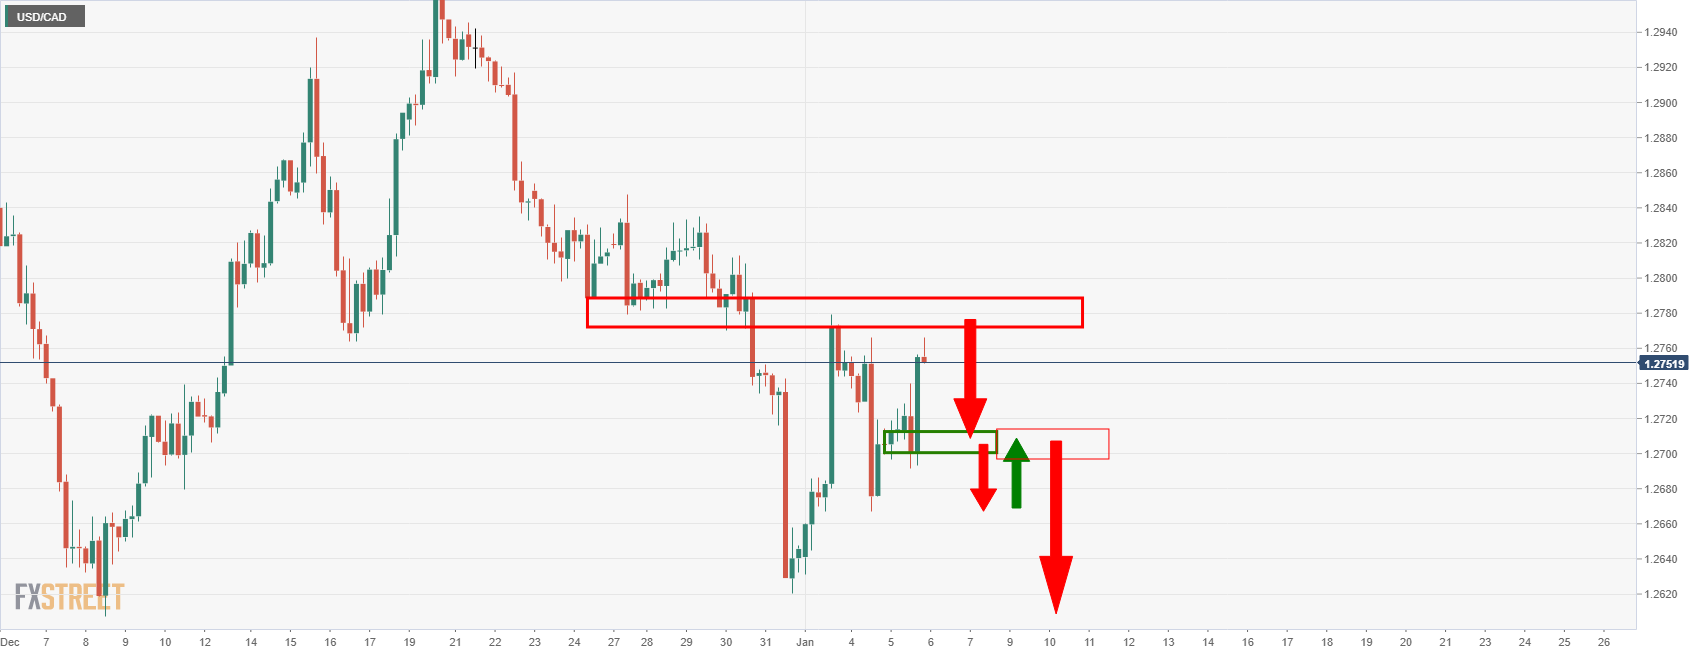
The price action is starting to play out:
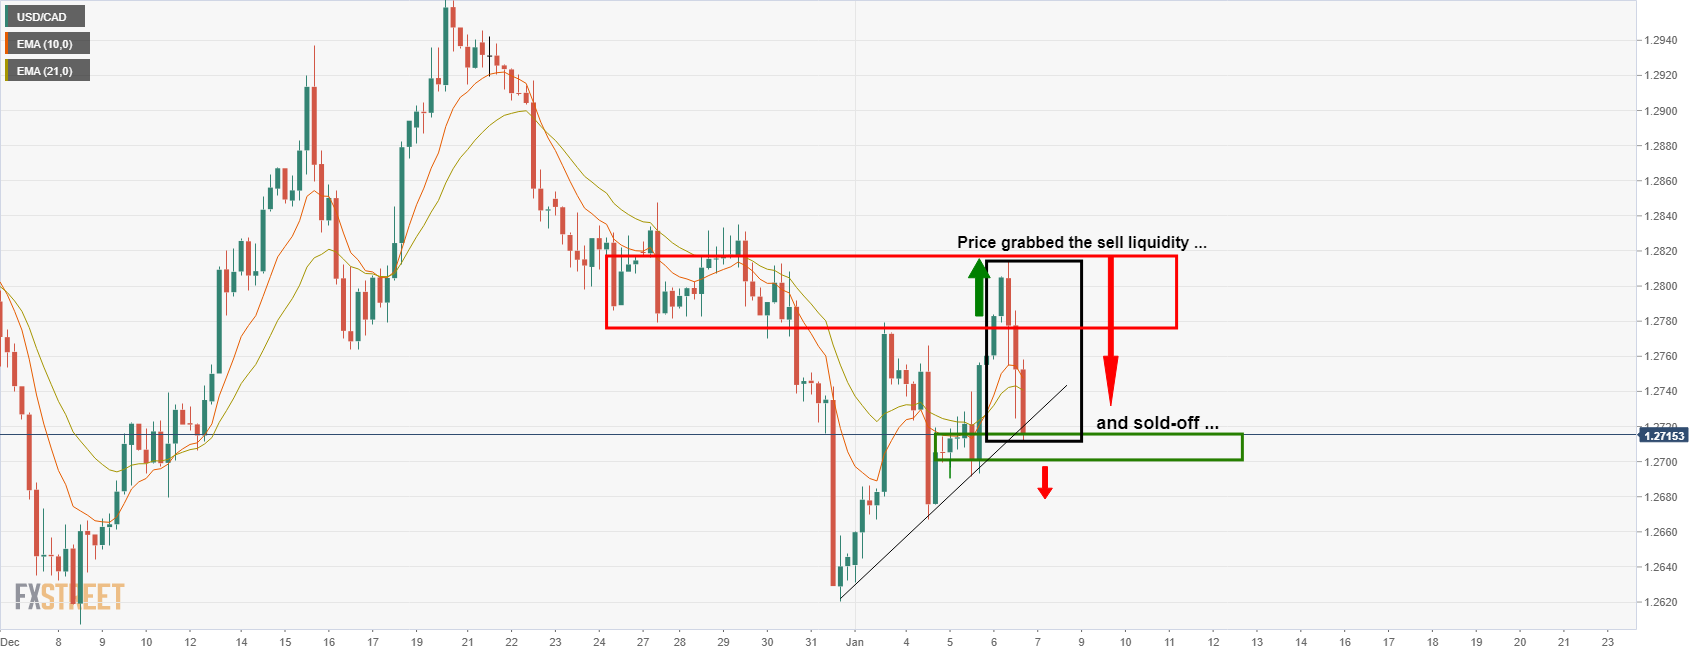
As illustrated above, the price ran into the sell stops above the prior highs and into a high volume area where the sellers took back control as a discount, as per the title of the prior analysis: (USD/CAD Price Analysis: Bears line up for their discounts).
This has marked the price action on the daily chart as follows:
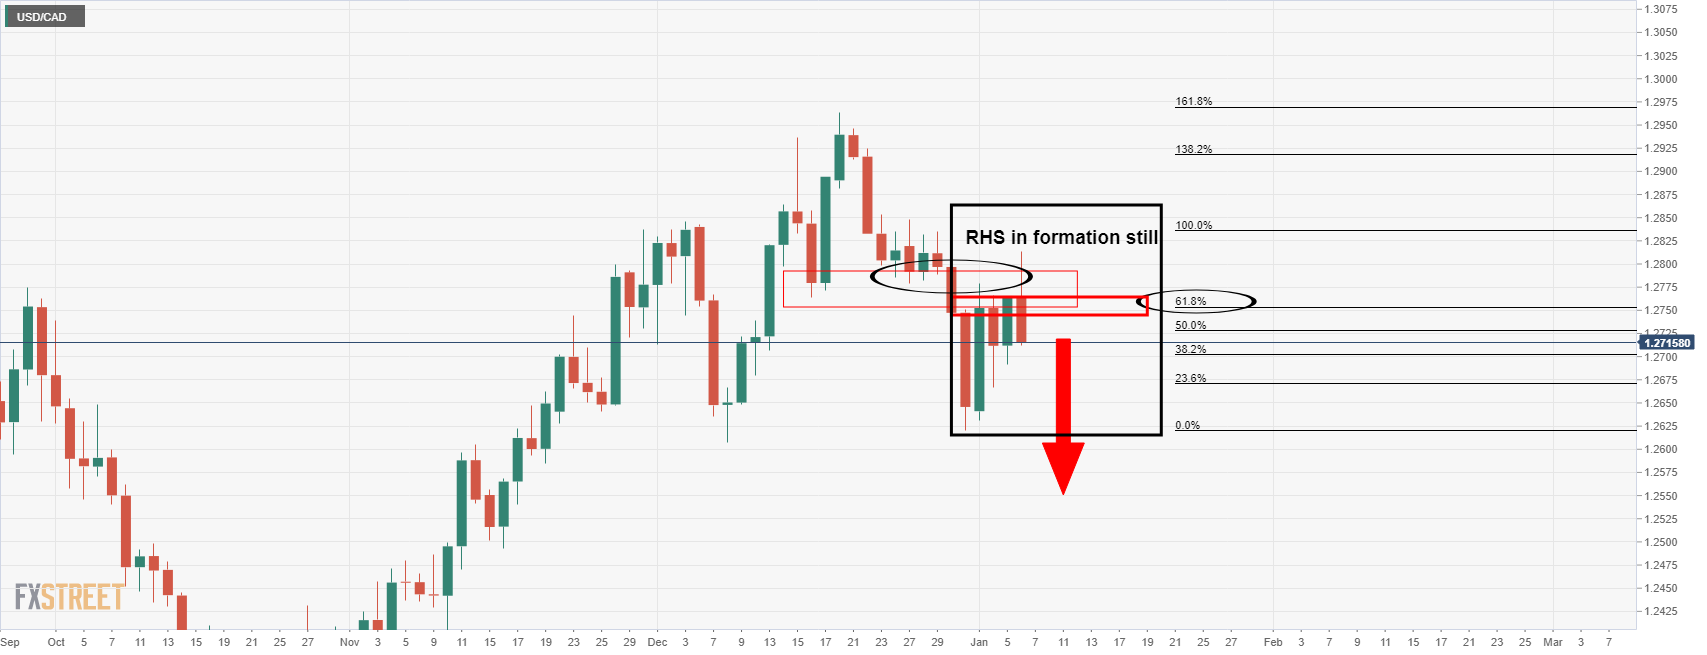
The right-hand shoulder (RHS) of the head and shoulders is taking shape. We now need to see a break out below the 4-hour support for a run to the H&S neckline between 1.2620 and 1.2600:
Author

Ross J Burland
FXStreet
Ross J Burland, born in England, UK, is a sportsman at heart. He played Rugby and Judo for his county, Kent and the South East of England Rugby team.


