S&P 500 Forecast 2020: When will equities peak? A guide for stock market bears
- The most profitable bull market in history arouses a lot of interest among bears.
- The fourth year of the presidential term has, on average, the worst performance in the S&P 500.
- The trade war, the Brexit or Trump appear to be the most critical threats for a market insensitive to dangers.

American stock market indices have started the new year at record highs. On Thursday 2, the futures market shows a 0.91% increase and the S&P 500 index close to hitting the 3250 price level.
The current upward trend began in March 2009, when the S&P 500 hit the 660-point zone of the global stock market benchmark.
Since then, the strong coordinated actions of all the major central banks of the world, injecting trillions of dollars into the economic system, have driven the American indices to new annual highs.
It is more than evident that the current situation is unsustainable. The current stratospheric price levels in the S&P 500, Dow Jones or Nasdaq are the result of an immense flow of cheap money that has kept alive a system that in 2009 was destined to fall into a depression of unknown dimensions.
Amphetamine treatment has worked, but it is not difficult to understand that the basis of the problem continues to be not only present but amplified. The central banks have done an excellent job, but they are hostage to their policies.
The markets have become addicted to the therapeutic injections prescribed by the Fed and they remain caught up in the illusion that these treatments can become chronic.
Below is a summary of what has been a decade of a long-term, non-stop uptrend:
Upward trends from the 2009 lows in the S&P 500:
- 2009/10: +93.26% (636.5 points)
- 2010/11: +33.25% (357.0 points)
- 2012/16: +63.48% (1130.32 points)
- 2016/18: +36.99% (861.62 points)
- 2019/20: +38.40% (898.74 points) – Still active.
Bearish trends from the 2009 lows in the S&P 500:
- 2010: -17.03% (-207.97 points)
- 2011: -21.73% (-298.50 points)
- 2012: -11.36% (-162.41 points)
- 2015/16: -15.26% (-325.59 points)
- 2018: -20.52% (-603.46)
-637136465567848675.png)
At present, the market seems to ignore any threat other than the end of cheap money. Fortunately, the lack of inflation allows the central bankers to continue with their strategy.
Let's take a quick look at the main factors that have influenced and will influence market confidence in the run-up to 2020.
S&P 500 analysis: The reasons for irrational market confidence
US-China trade war
The year we left behind was marked by the trade war between the United States and China initiated by President Donald Trump. For the moment, the two giants have shown that they respect each other and that neither of them feels strong enough to escalate the conflict for fear of reprisals.
But the conflict has left other spin-offs that can impact on the markets. China has certified this year that it cannot depend technologically on the USA.
The pressure imposed by the American government may have accelerated a strategy in the Asian giant that could mean the loss of substantial income for the American technological industry, which is the one that supports the current values in the stock exchange indexes.
Brexit
Although the weight of the British economy is far from the two global giants, its instability as a global financial center is a risk to the confidence of the world's big investors.
The overwhelming victory of Boris Johnson in the recent elections and his commitment to leave the EU on January 31 will put a good deal of tension on capital flows and the result is uncertain.
The City of London is home to all the major global financial institutions, and a shock to their accounts could quickly spread to New York, Frankfurt or Tokyo. All of these institutions have prepared thoroughly for the event, but there is room for error.
The implications for continental Europe are not insignificant either. The resolution of the Scottish and Irish post-Brexit issues may exacerbate the situation of other territories wishing to constitute themselves as nations within the European Union itself.
The German locomotive has gone through some difficult times in 2019, but forecasts point to an improvement from Q2 2020 onwards. France, for its part, is immersed in social conflict following the Macron government's proposal to reform the pension system.
Trump’s impeachment
The revelation of illegal maneuvers by US President Trump's team against Democratic candidate Joe Biden has led Trump to face an impeachment process by the United States Congress and Senate. Although the chances of the Senate voting against the president are low, the impact on voters might be significant.
A hypothetical Republican failure in the November election would move investors sentiment into the fear area, since they can consider that a Democratic Party administration would revive the universal health care program, among other measures which the market might perceive as negative.
US 2020 Presidential Race: When to buy and sell US dollar and stocks
S&P 500 forecast: The technical story
Since the 2009 lows, the S&P 500 has experienced four major upward movements, not counting the current one which is still active, and five smaller downward trends.
After the last downward leg in 2018, the S&P 500 chart has moved to the bottom of the Pitchfork lines for the first time since 2009. The middle line, which is now resistance, is at the 3400 level in early 2020 and will move to about 4000 by 2021.
It is unlikely that the price will break out of the upper zone again, with the price likely to look for the lower line sooner rather than later.
As of January 1st, 2020, the baseline passes below the 2600 level and will still be below 3000 by 2021.
The current momentum that has driven the S&P to record highs began in early November after a head & shoulder breakout. The figure's projection indicated a technical target of 3664.68 (+20.4%).
The current uptrend in the S&P 500 is breaking all historical records and patterns of the American macro index. Not even the 3000 points have been able to stop the movement.
What's next in 2020?
The head & shoulder figure has been a determining factor in 2019 and the market has been very attentive to it. As soon as the price confirmed the continuity of the upward technical pattern, the buying-call recommendations have reflected in the price.
Everyone knows that the uptrend is close to its limits, but no one wants to be left out of the biggest bull market in the history of the S&P 500.
The bullish target at the time of the figure's breakout indicated that the price will head approximately towards the 3680 price level, as seen in the chart below.
-637136466157081656.png)
The application of the Pitchfork tool allows us to divide a trend into two clear regions of price development: the upper or "bullish" zone and the lower or "bearish" region.
The S&P 500 has been moving since late 2018 in the weakest zone of the current trend but far from jeopardizing its permanence.
The return to the upper zone is uncommon, so I assume the most likely scenario of a price evolution is within this "bearish" zone within the overall uptrend.
With this premise, the first possibility that the S&P 500 index has of reaching the 3680 bullish target would occur at the end of July.
-637136467058629130.png)
The same technical scenario in another type of graphic representation:
-637136467848337601.png)
S&P 500 technical indicators point to some bearish targets
Technical indicators are not very useful by themselves to make future projections, but the information we have about the relationship between behavior patterns and price is.
In this case, the projection will be supported by moving averages, Bollinger Bands, MACD and Directional Moving Average.
Since we are talking about predicting the behavior in the short term of a trend of more than a decade, I consider it appropriate to take the analysis to the higher periods that allow us to take some perspective.
The monthly range chart places the 50-period exponential average at the level of 2616, while the 100-period simple average is at 2145 and the 200-period simple average is at the distant price level of 1672.
This monthly time range data helps us to see that since the end of 2011 the price has increased very quickly and the level of deviation is high. A drop of 50% to the 200-moving-average level is statistically likely.
To complete this long term analysis, I include the extension of the trend line created by the fall that occurred between 2015 and 2016 (-15.26%).
Weekly chart
-637136462082388256.png)
The weekly chart of the S&P 500 allows us to see that already in this long-term time range; all the moving averages are moving within the lower Pitchfork channel, which gives us an idea of the magnitude of the current trend.
A price reversal that does not affect the monthly chart would safely remain within the current bullish scenario.
The discordant note comes from the Directional Movement System indicator, where despite the historically high levels, the bulls lose strength and even point downwards.
Stat of the year
The fourth year of the presidential cycle is the one with the worst returns in the historical series.
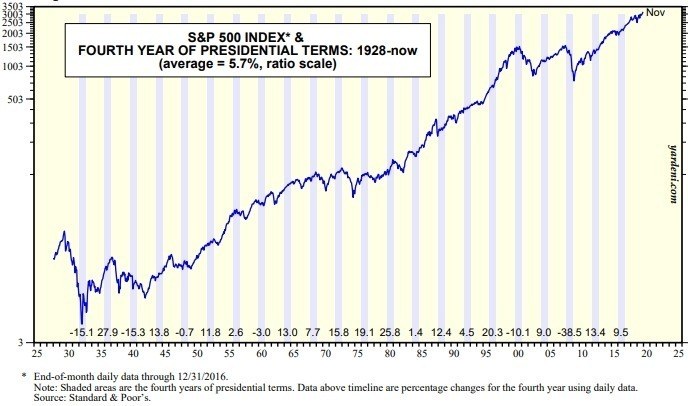
The average accumulated earnings in this last year of the legislature have an average return of 5.7% since 1920, compared to the 12.8% average return that occurs, for example, in the third year of the presidential term.
Meaningful quotes
John Maynard Keynes:
The market can remain irrational longer than you can remain solvent.
This great quote from Keynes sums up perfectly the hidden dangers of the current situation.
The lift operator:
Everyone is expecting a sharp correction in the American market.
The market never does what everyone expects, especially when everyone expects it.
Conclusion
- The current bull market has exceeded all expectations. The coordinated action of central banks has managed to generate a perma-bull effect in the world's leading exchanges.
- After a decade of purchases financed with cheap central bank money, the market has no incentive to change the strategy if conditions do not change. Central banks stated to maintain incentives for as long as necessary.
- The major S&P 500 companies have been using cheap money to support expensive stock buyback programs. If these corporations see their profits fall and need liquidity, the sale of their stock can have a knock-on effect.
- The elephant in the room is public debt. The silent killer is currency inflation.
-637136463717541974.png)
If we continue with the initial scenario, the S&P 500 will peak in the mid-summer of 2020 at over 3600. At that time, support levels would be first at around 3000, then the second long-term support near 2500 and the third one in the SMA200 area on the monthly chart, already below 2000.
This article belongs to the 20 trading ideas for 2020 series. Check the full list of 2020 pieces.
Author

Tomas Salles
FXStreet
Tomàs Sallés was born in Barcelona in 1972, he is a certified technical analyst after having completing specialized courses in Spain and Switzerland. He expanded his technical training following the guidance of great experts on the financial markets.


