Oil outlook: Mid-East awaits Israel’s retaliatory strike

WTI’s upward movement last week appears to have been interrupted, with the movement of the commodity’s price action appearing to be moving in a downwards fashion since the beginning of the week, in an indication of the sensitivity of the oil market to its fundamentals. In today’s report we have a look at the situation in the Middle East, the IEA’s report and the state of the US oil market. The report is to be concluded with a technical analysis of WTI’s daily chart.
Mid-East on edge, with markets awaiting Israel’s retaliatory strike
Tensions in the Middle East remain elevated, yet the situation appears to have subsided to some degree. In particular, we would like to reference the recent reports from the US Government, that they have received assurances from Israeli officials, that no Iranian oil and nuclear facilities would be attacked during their widely anticipated retaliatory strike. In turn, the alleged assurances from Israeli officials to the US, tend to have dampened market worries about a potential shortage in supply stemming from Iranian oil facilities and that the global oil trade may not be interrupted. Therefore, the apparent willingness from Israel to refrain from escalating the situation even further may have weighed on oil prices. However, recent reports have emerged that Israel’s plan to strike against Iran is ready, and thus should Israel renege on the alleged promises, and decide to strike oil facilities or even Iranian nuclear facilities, the possibility of a regional war may be intensified, which may send oil prices roaring higher. Nevertheless, Iran has vowed to retaliate against any future Israel strike, which could escalate tensions regardless of the targets Israel may decide to strike, although we would not be surprised if the comments are simply posturing from the Iranian side in order to “save face”. In conclusion, should tensions in the region subside, we may the reduced possibility of a regional war, weighing on oil prices. Whereas should tensions escalate with the possibility of a regional war increasing, it may aid oil prices.
IEA cuts global Oil demand forecasts
The IEA has released its October oil market report for 2024, in which the IEA states that “China underpins the deceleration in growth, accounting for around 20% of global gains both this year and next year, compared to almost 70% in 2023”. Moreover, the IEA stated in the same report that they “stand ready to act if necessary” and that in the absence of a major disruption, the market is faced with a sizeable surplus in the new year. Overall, the IEA report tends to paint a picture of a reduction of oil demand stemming from China which in combination with adequate oil supplies, may weigh on the liquid gold’s price.
Uptick in demand from the US Oil market
We make a start with the data for the US oil market since our last report, by noting that the Baker Hughes oil rig count increased by two from 479 to 481. The release tended to imply an uptick in the US oil market, yet it does not appear to have excited oil traders. Signals for the aforementioned uptick in the US oil market intensified on Tuesday as the American Petroleum Institute reported a decrease of US oil inventories, by -1.580 million barrels which appears substantial when compared to last week’s increase of US oil inventories by 10.9 million barrels. The data highlighted how oil demand levels surpassed production levels, which in theory may have aided the commodities price, even temporarily as the figure may have taken market participants by surprise, yet the boost to oil prices appears to have only been temporary. Should we see further signs of an uptick in demand in the US oil market we may see the data aiding oil prices as the demand levels in the US oil market could surpass production levels.
Technical Analysis
WTI cash daily chart
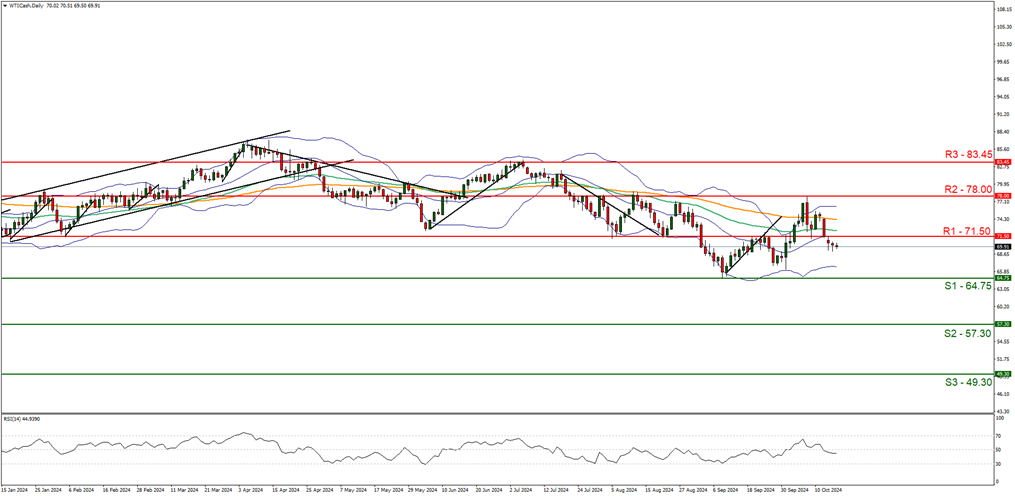
Support: 64.75 (S1), 57.30 (S2), 49.30 (S3).
Resistance: 71.50 (R1), 78.00 (R2), 83.45(R3).
WTI appears to be moving in a downwards fashion after breaking below our support turned to resistance at the 71.50 (R1) level. We opt for a bearish outlook for the commodity and supporting our case is the RSI indicator below our chart which has broken below the reading of 50 and currently registers a figure near 40, implying a bearish market sentiment. For our bearish outlook to continue we would require a clear break below the 64.75 (S1) support level with the next possible target for the bears being the 57.30 (S2) support line. On the flip side, for a sideways bias we would require the commodity’s price to remain confined between the 64.75 (S1) support level and the 71.50 (R1) resistance line. Lastly, for a bullish outlook, we would require a clear break above the 71.50 (R1) resistance line with the next possible target for the bulls being the 78.00 (R2) resistance level.
Author

Phaedros Pantelides
Independent Analyst
Mr Pantelides has graduated from the University of Reading with a degree in BSc Business Economics, where he discovered his passion for trading and analyzing global geopolitics.


