NZDUSD Trading in A Bearish Cycle - Elliott wave Analysis

Hi traders,
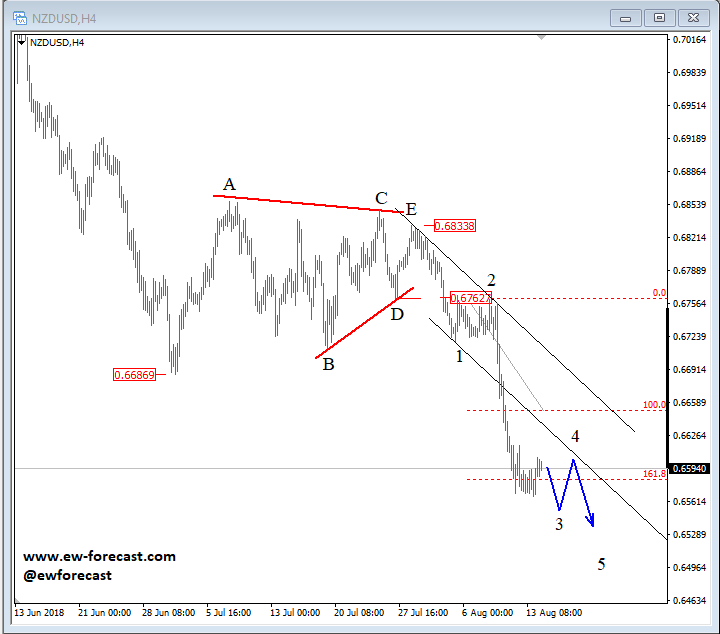
NZDUSD is trading lower, unfolding a new five-wave drop out of a triangle correction located at 0.6834 level. We are observing wave 3 that is now trading below the lower Elliott wave channel line and at Fibonacci projection target of 161.8. Some support can be found here, and a new temporary three-wave rally can follow, which can later look for resistance around the 0.6600 area.
NZDUSD, 4h
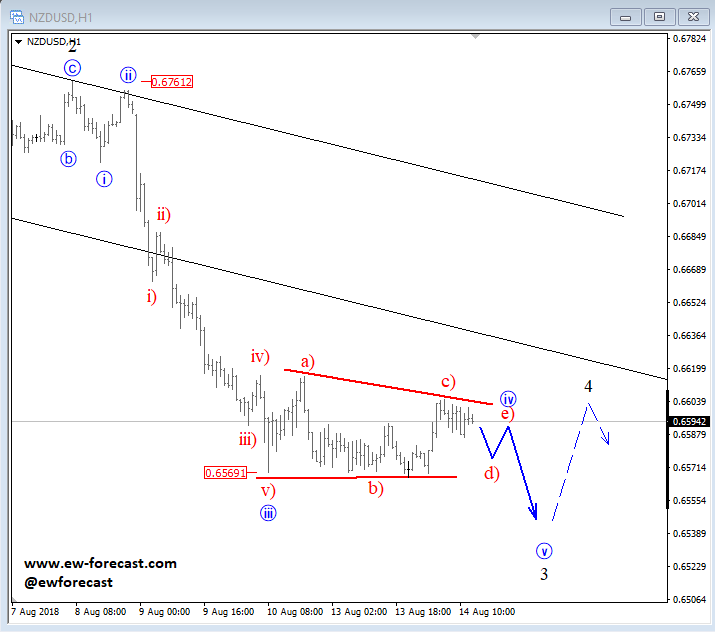
Now taking a closer look at the intra-day chart of NZDUSD, where we see a nice five-wave bearish development from the highs.
Higher degree wave 3 unfolded three minor legs, and is now unraveling a choppy and slow price movement within wave iv which looks to be a triangle. A triangle is a five-legged correction that moves into the direction of the trend and also unfolds prior to the final wave. That said, once wave iv correction fully shows up,a new drop towards wave v of 3 may follow.
NZDUSD, 1h
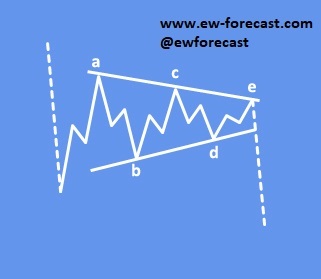
A Triangle is a common 5-wave pattern labeled A-B-C-D-E that moves counter-trend and is corrective in nature. Triangles move within two channel lines drawn from waves A to C, and from waves B to D. A Triangle is either contracting or expanding depending on whether the channel lines are converging or expanding. Triangles are overlapping five wave affairs that subdivide 3-3-3-3-3.
Triangles can occur in wave 4, wave B, wave X position or in some very rare cases also in wave Y of a combination.
A theoretical example of a triangle pattern:
If you would like more analysis like this and more knowledge then please visit our website at www.ew-forecast.com and subscribe for a 14-day Trial, where you will have access to our fx, gold, silver, sp500, dax, 10yr notes, bunds and btcusd analysis with monthly, daily and intra-day time frames. All of this and more for 1€.
Author

Gregor Horvat
Wavetraders
Experience Grega is based in Slovenia and has been in the Forex market since 2003.


