Is the Bond Bull Market Over?

In the book Behavioural Investing: A Practitioner's Guide to Applying Behavioural Finance by James Montier, a psychological experiment is discussed whereby a participant is excluded from a game by two other supposed players. At the same time, the participant's brain function was being monitored. The imagery of the brain showed that the participant that was being excluded from the crowd showed the same type of activity as someone who was undergoing physical pain. This is interesting because it brings to light the inherent herding predisposition we all face as human beings. In essence, going against the crowd through self-exclusion, or otherwise, is similar to breaking your arm.
Is the bond bull market over? It seems like everyday we are reading something about interest rates moving up. The best is when the financial media claims the market went down because of higher interest rates when, in fact, rates declined on that day. When volatility came back into the market in a big way last week, interest rates were the first to blame.
Interest rates have certainly increased this year. The Fed has lifted short-term rates, and even long-term rates have moved up as the US economy recovered from what we believe was a recession from 2015 to early 2016.
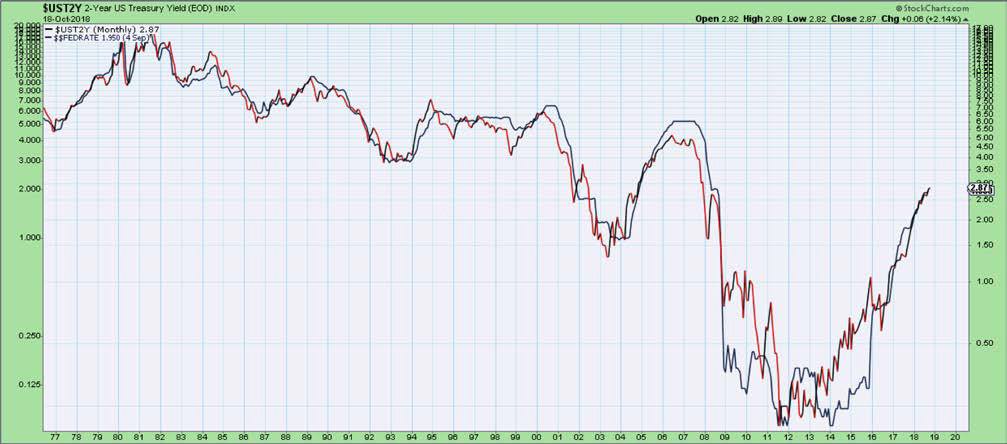
Chart 1: 2-Year US Treasury Yield (UST2Y)
Long-term interest rates bounced alongside the US economy. Now, all of a sudden, because some magic number was breached, the bond bull market is supposedly dead according to a majority of market pundits. Whenever the majority believes something is true, we tend to at least evaluate the other side of things. Everyone (or at least most market strategists we read or see on financial news) seems to believe that interest rates are going to continue to go higher, much higher. Even the bond king himself, Jeff Gundlach, has been featured on prominent financial news stations claiming that long-term interest rates were heading higher and that bonds were, in turn, heading lower.
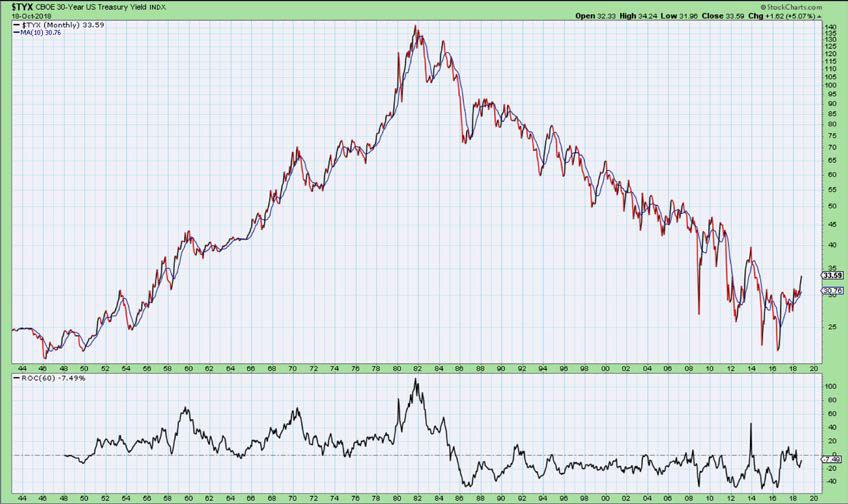
Chart 2: 30-Year US Treasury Yield (TYX)
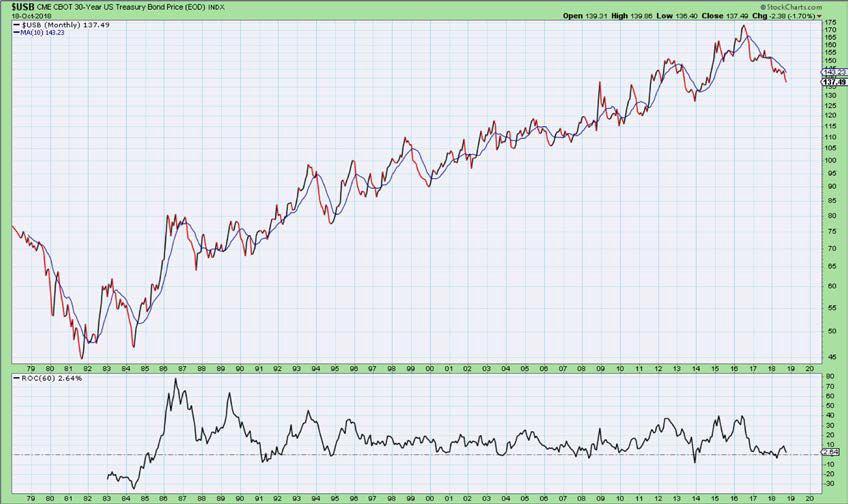
Chart 3: 30-Year US Treasury Bond Price (USB)
It is our opinion, however, that the move in long-term interest rates may be approaching a peak. However, we do not know whether it is a short-term peak or long-term peak, for that is only known in hindsight. What we do know is that US economic growth and inflation should decelerate from here. With that, we expect long-term interest rates to move downward. Short-term interest rates could have further room to climb as the Fed continues its systematic path to "normalization". The long-term rates should end their rise from the 2016 lows in the near future as the yield curve inverts sometime before the end of the 1st quarter of 2019.
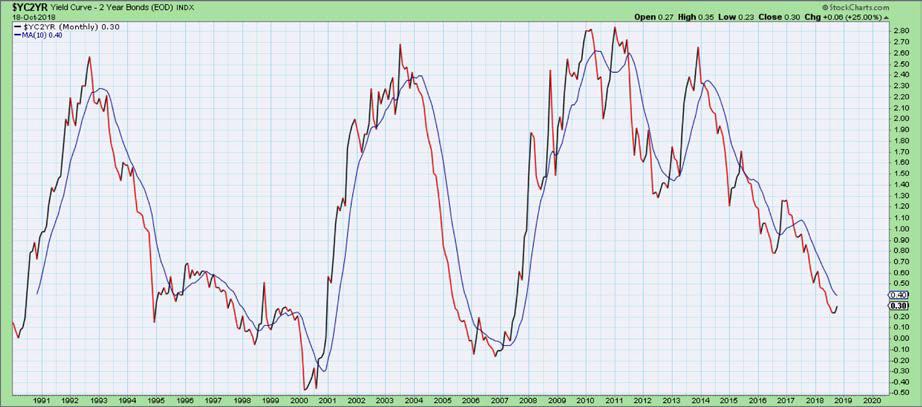
Chart 4: 2 Year Bonds Yield Curve (YCZYR)
We believe that long-term rates will move down because we believe we have seen the peak in growth and inflation. The Economic Cycle Research Institute's Weekly Leading Index has demonstrated a deceleration year over year and is closely approaching an outright decline. This coincides with our expectation of US economic growth decelerating going forward and interest rates falling in conjunction.
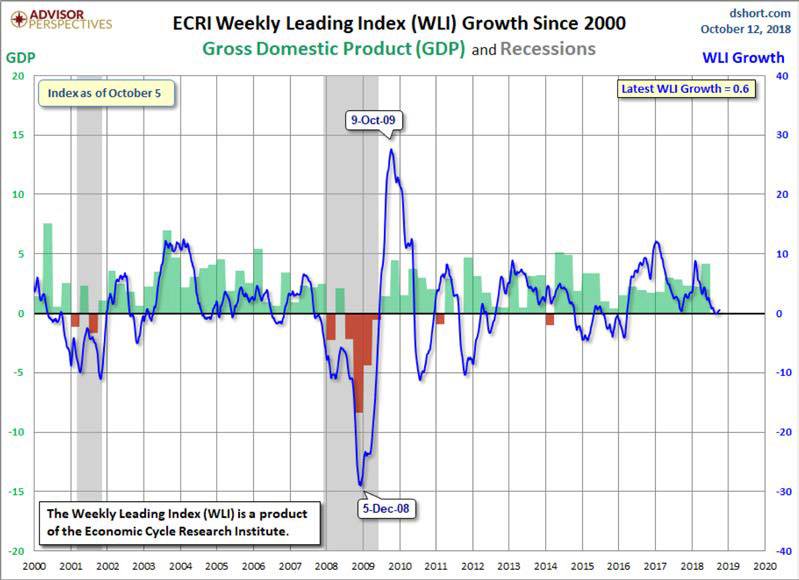
Chart 5: ECRI Weekly Leading Index Growth Since 2000 (WLI)
Inflation expectations are also falling. The 5 year breakeven rate forward inflation rate peaked from a rate of change perspective on a year over year basis. The copper to gold ratio is also suggesting that market participants are no longer expecting inflationary pressures. This ratio correlates strongly with long-term interest rates (at least historically). This ratio is diverging from interest rates, suggesting that rates could move down as the gap closes.
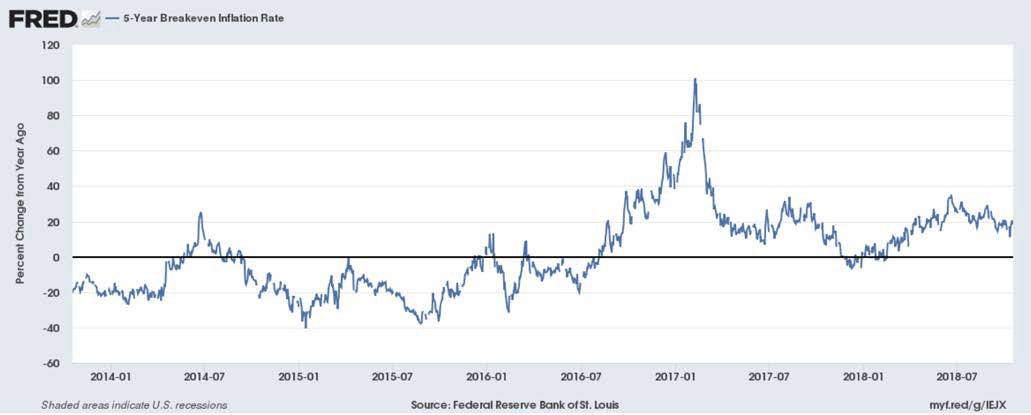
Chart 6: 5-Year Breakeven Inflation Rate
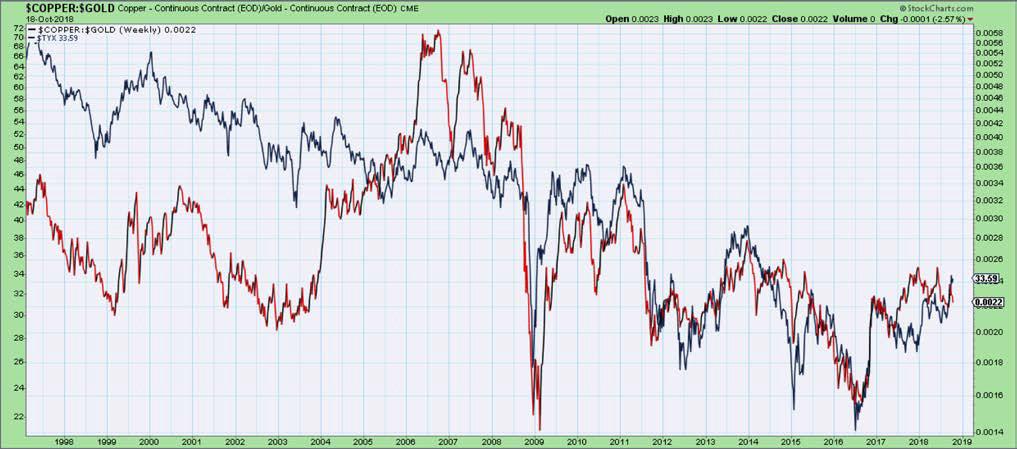
Chart 7: Copper versus Gold
IN CONCLUSION...
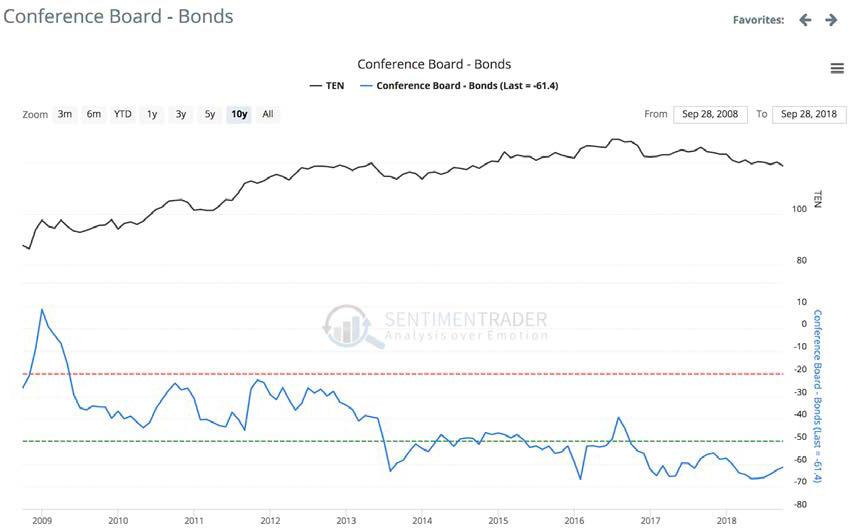
Sentiment is terribly bearish concerning long-term bonds. The conference board survey below, which measures how many consumers think bonds will increase, is currently at extremely pessimistic levels. As we referenced several articles ago, when bond sentiment has been this pessimistic historically, bonds have typically increased in price going forward. Based on the evidence, we believe we may see the same outcome again.
Author

Clint Sorenson, CFA, CMT
WealthShield


