• Despite breaking to an 8.6-year high gold could only end this week 1.22% higher.
  • The precious metal looks set to test the all-time highs at $1920.94 per ounce.

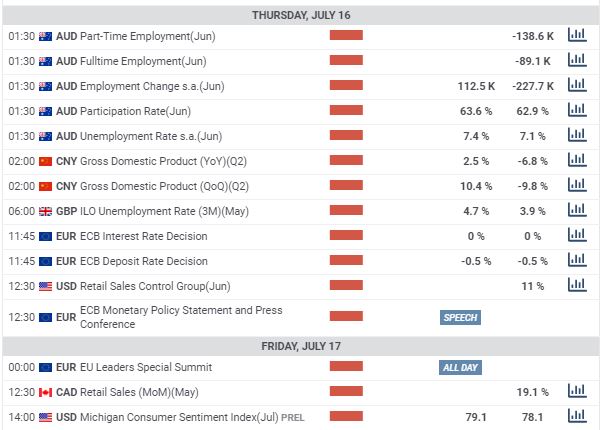
Fundamental backdrop - Lots of data next week.

It was the drop in the dollar and mixed sentiment in stocks that sent gold to an 8.6-year high this week. Recently when the coronavirus pandemic situation gets worse then the US dollar gets strong but this seems to be a more localised problem for the US. The UK and EU seem to have a much better grasp of the situation and this led the dollar to weaken. Recently the UK added more fiscal stimulus too and since then the pound has outperformed. The more monetary stimulus gets added the strong gold will become but we would need an environment where stocks stall and the dollar weakens to see another push to the all-time highs. Everything in the financial markets moves in ratios so this could just be a slow grind but one thing is for sure we need to keep an eye on the Fed. 

Next week there are lots of important data announcements. The ECB and BoC will be announcing their latest rate decisions and policy measures. The key in these events is forward guidance. Both of these central banks are not projected to move on rates. But if there is any indication that more stimulus to be added it could make a difference. There is also the latest GDP readings from the UK and China. The Chinese GDP reading will be important for global risk sentiment. If the reading is poor then there could be a flight to safety and maybe gold will benefit. 

FX Calendar Mon - Wed

FX Calendar Thurs - Fri

Technical Picture - Will USD 1800 per ounce hold?

On the gold weekly chart, you can see the price has stalled at the 138.2% Fibonacci extension. The market is due a correction and looking at the Relative Strenght Index there is a big divergence. This means there could be a move lower or a retracement in this uptrend. The USD 1800 per ounce level is a strong resistance and it would not be a massive surprise if the market has a rest from the relentless uptrend.

Gold Weekly Chart

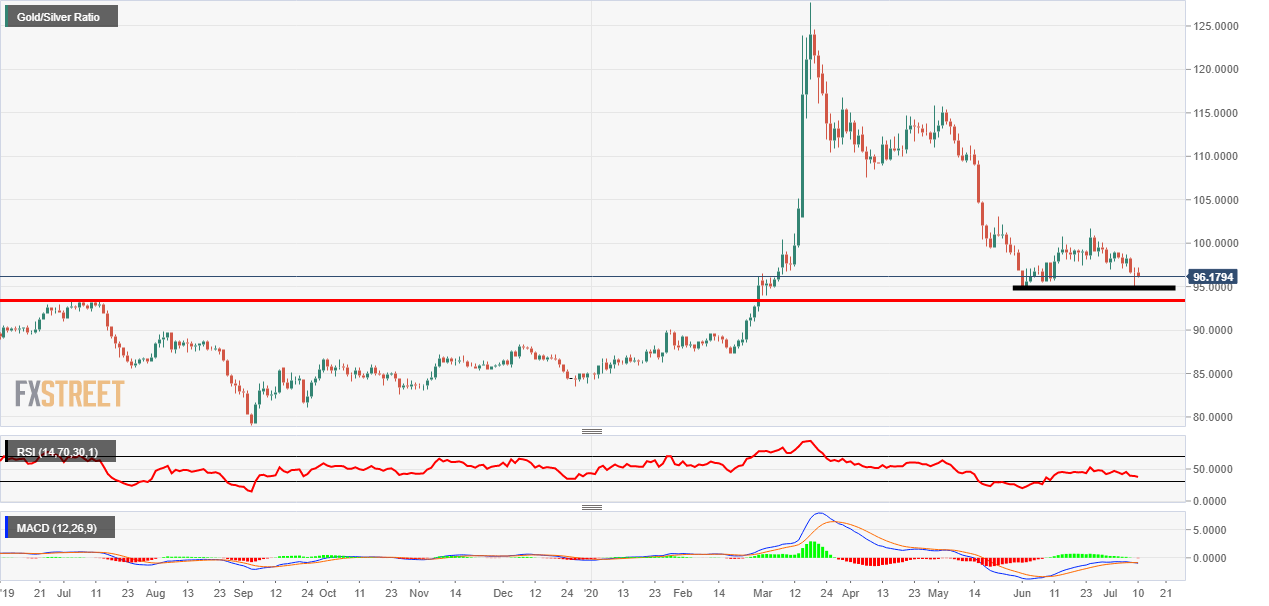
The Gold/Silver ratio shows that it could be silvers time to shine. As you can see from the chart below the price might break out to the downside. This could mean the rate of change against the US dollar. The MACD has dropped below the zero level and the histogram is now in the red. The signal lines also remain under the mid-point so all signals are pointing to silver outperforming its big brother.

Gold Silver Ratio

Forecast Poll - XAU/USD

The one-week forecast poll shows traders are still pretty bullish and think the price could extend further past the USD 1800 per ounce level. Looking further ahead, the pollsters believe think we are at the right levels at the moment. Interesting that in the longer-term measurements not many traders believe the precious metal will move sideways but the forecast price is close to the current level.

Gold Forecast Poll Results

Links to other gold-related articles

Surge in coronavirus spooks investors as China takes profits

Is the ‘party’ in gold just getting started?


All information and content on this website, from this website or from FX daily ltd. should be viewed as educational only. Although the author, FX daily ltd. and its contributors believe the information and contents to be accurate, we neither guarantee their accuracy nor assume any liability for errors. The concepts and methods introduced should be used to stimulate intelligent trading decisions. Any mention of profits should be considered hypothetical and may not reflect slippage, liquidity and fees in live trading. Unless otherwise stated, all illustrations are made with the benefit of hindsight. There is risk of loss as well as profit in trading. It should not be presumed that the methods presented on this website or from material obtained from this website in any manner will be profitable or that they will not result in losses. Past performance is not a guarantee of future results. It is the responsibility of each trader to determine their own financial suitability. FX daily ltd. cannot be held responsible for any direct or indirect loss incurred by applying any of the information obtained here. Futures, forex, equities and options trading contains substantial risk, is not for every trader, and only risk capital should be used. Any form of trading, including forex, options, hedging and spreads, contains risk. Past performance is not indicative of future FX daily ltd. are not Registered Financial Investment Advisors, securities brokers-dealers or brokers of the U.S. Securities and Exchange Commission or with any state securities regulatory authority OR UK FCA. We recommend consulting with a registered investment advisor, broker-dealer, and/or financial advisor. If you choose to invest, with or without seeking advice, then any consequences resulting from your investments are your sole responsibility FX daily ltd. does not assume responsibility for any profits or losses in any stocks, options, futures or trading strategy mentioned on the website, newsletter, online trading room or trading classes. All information should be taken as educational purposes only.

Recommended Content


Recommended Content

Editors’ Picks

EUR/USD regains traction, recovers above 1.0700

EUR/USD regains traction, recovers above 1.0700

EUR/USD regained its traction and turned positive on the day above 1.0700 in the American session. The US Dollar struggles to preserve its strength after the data from the US showed that the economy grew at a softer pace than expected in Q1.

EUR/USD News

GBP/USD returns to 1.2500 area in volatile session

GBP/USD returns to 1.2500 area in volatile session

GBP/USD reversed its direction and recovered to 1.2500 after falling to the 1.2450 area earlier in the day. Although markets remain risk-averse, the US Dollar struggles to find demand following the disappointing GDP data.

GBP/USD News

Gold climbs above $2,340 following earlier drop

Gold climbs above $2,340 following earlier drop

Gold fell below $2,320 in the early American session as US yields shot higher after the data showed a significant increase in the US GDP price deflator in Q1. With safe-haven flows dominating the markets, however, XAU/USD reversed its direction and rose above $2,340.

Gold News

XRP extends its decline, crypto experts comment on Ripple stablecoin and benefits for XRP Ledger

XRP extends its decline, crypto experts comment on Ripple stablecoin and benefits for XRP Ledger

Ripple extends decline to $0.52 on Thursday, wipes out weekly gains. Crypto expert asks Ripple CTO how the stablecoin will benefit the XRP Ledger and native token XRP. 

Read more

After the US close, it’s the Tokyo CPI

After the US close, it’s the Tokyo CPI

After the US close, it’s the Tokyo CPI, a reliable indicator of the national number and then the BoJ policy announcement. Tokyo CPI ex food and energy in Japan was a rise to 2.90% in March from 2.50%.

Read more

Majors

Cryptocurrencies

Signatures