Gold Weekly Forecast: There are some very interesting Fibonacci extensions from the 1980's
- Gold has risen 10.74% in the month of July that is the biggest monthly increase since February 2016.
- As the price is breaking all-time highs it's hard to say where the precious metal could end up.

Fundamental Backdrop - GDP data has been dire this week
There has been lots of data to digest this week and maybe the Fed's, non-committal tone was enough to put the breaks on gold for now. The Federal Reserve has stated they keep the rate of QE at the current levels. There could have been a small chance that they would have committed to a more aggressive stance. Gold pushes higher whenever the Fed announce any more stimulus and the fact they didn't could have been the reason some of the more recent moves have not been as bullish. There is also a good chance they are waiting for the White House to get their act together and announce the next round of fiscal stimulus. Last week there was talk of a deal being finalised by Monday but this never happened.
This week the market also got the information that GDP in the US and Germany took its worst hit since the second world war. The two economic giants are paramount to the success of the global economy and a drop of 32.9% for the US was not welcome news. This can only make the safe-haven status for gold shine even brighter than it ever has done. Those who are late to the party may get another chance to jump on the bandwagon if more stimulus is added and data remains this bleak.
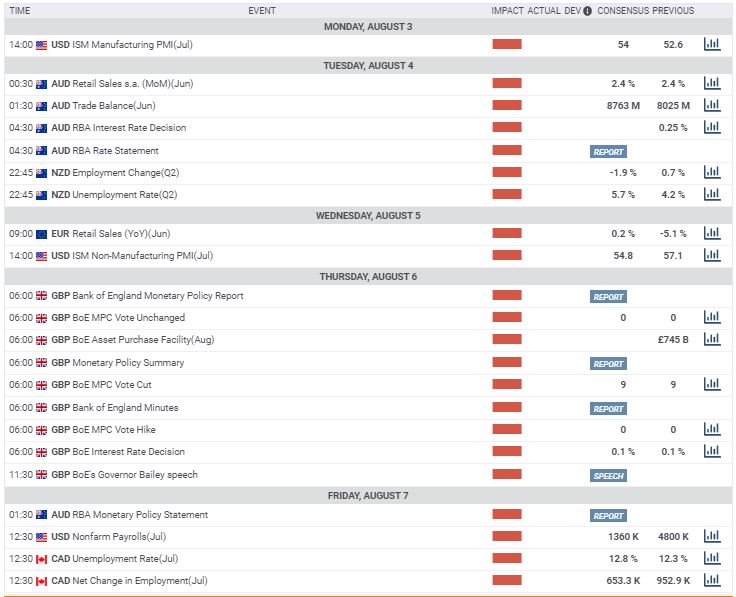
Next week - Non-farm payrolls are back
The main event by far will be the Non-farm payroll report. The weekly jobs data in the US is hinting there has been no sign of a recovery just yet as the initial claims and continuing claims data keeps getting worse. That is not to say there have not been surprises in the past.
We will also hear from the Bank of England and the Reserve Bank of Australia. Neither is expected to move on rates but the BoE has been talking about negative interest rates recently and maybe that will be on the agenda once again.
To me, it's not a huge surprise that PMI's are on the up as they are measured in a rate of change basis. Expect more of the same from the US and some analyst will be ranting and raving about the increase but it should be ignored.
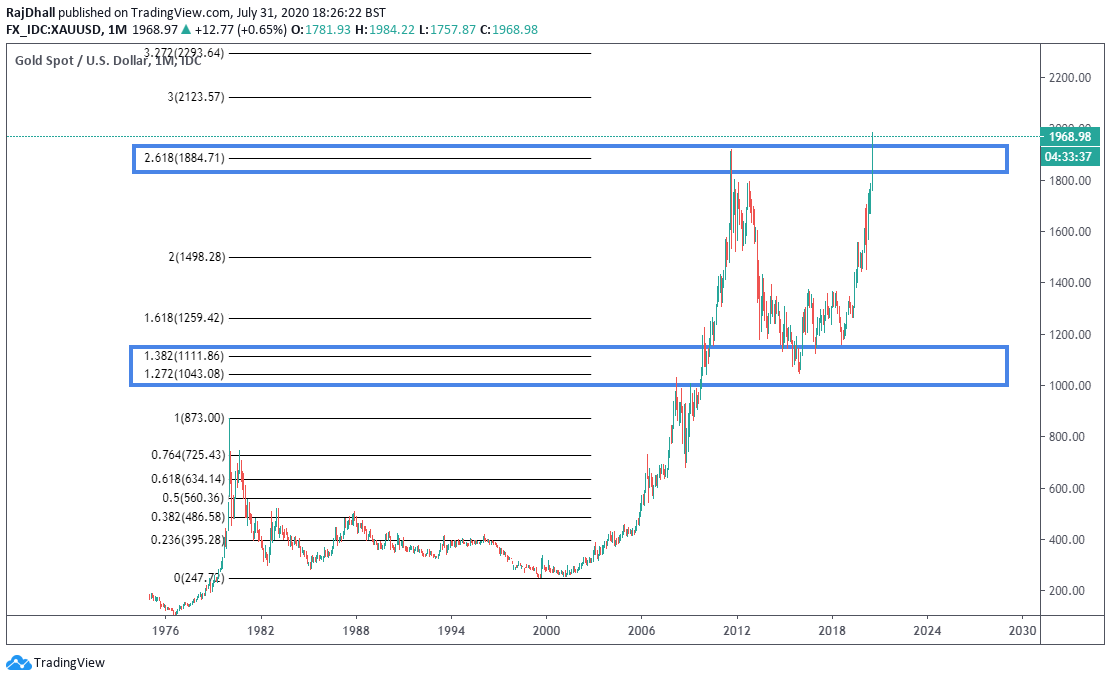
Gold monthly chart technical levels - Fibonacci forecast
Looking at the chart below it's is very hard to pick a top as we are in unchartered territory. As a technical analyst, I must use the tools I have been given and the Fibonacci extension tool worked like magic the last time this happened between January 1980 and the low of September 1999. The extensions projected to some key areas as you can see from the second chart. Looking at what could happen this time out the golden ratio of 161.8% is near USD 2500 per troy ounce. This may seem hard to fathom at the moment but it is a real possibility. Before that, the small matter of the USD 2000 per ounce psychological level has to be taken out first.
-637318127098757892.png)
The power of Fibonacci.
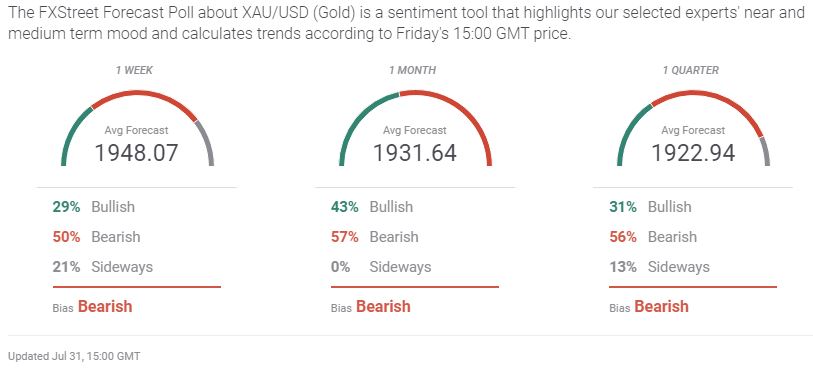
Trader and investor sentiment - Why are you always bearish?
At the moment the price of gold is around USD 1970 per ounce (at the time of writing). This means that traders are not so bullish on the outlook of the precious metal. As a reminder, this was the same last week and the price pushed higher once again. Remember the trend is your friend and if the White House manage to get they act together another round of stimulus could be positive for the yellow metal.
Additional links - HSBC, ANZ and last week's for reference
Gold gets the best of both US fiscal negotiations and potential stimulus agreement – HSBC
Premium
You have reached your limit of 3 free articles for this month.
Start your subscription and get access to all our original articles.
Author

Rajan Dhall, MSTA
FX Daily
Rajan Dhall is an experienced market analyst, who has been trading professionally since 2007 managing various funds producing exceptional returns.


