|

Gold to Silver ratio has started the next bearish leg

With tense geopolitical situation between two world super powers, ongoing war, and banking crisis, there’s no shortage of black swan events. Gold and Silver have performed very well in this environment. After 3 years of consolidation, they look to have formed major low earlier this year and ready for the next bullish cycle. We will look at the Gold-to-Silver ratio (AUG) which has an inverse correlation to the underlying physical Gold and Silver. In other words, when the ratio is going higher, both Gold and Silver go down. Conversely, when the ratio turns lower, both Gold and Silver go up in price. In both cases, Silver outperforms Gold in upside as well as downside.  Let’s see the latest daily outlook of AUG below.

Gold to Silver ratio daily chart

AUG

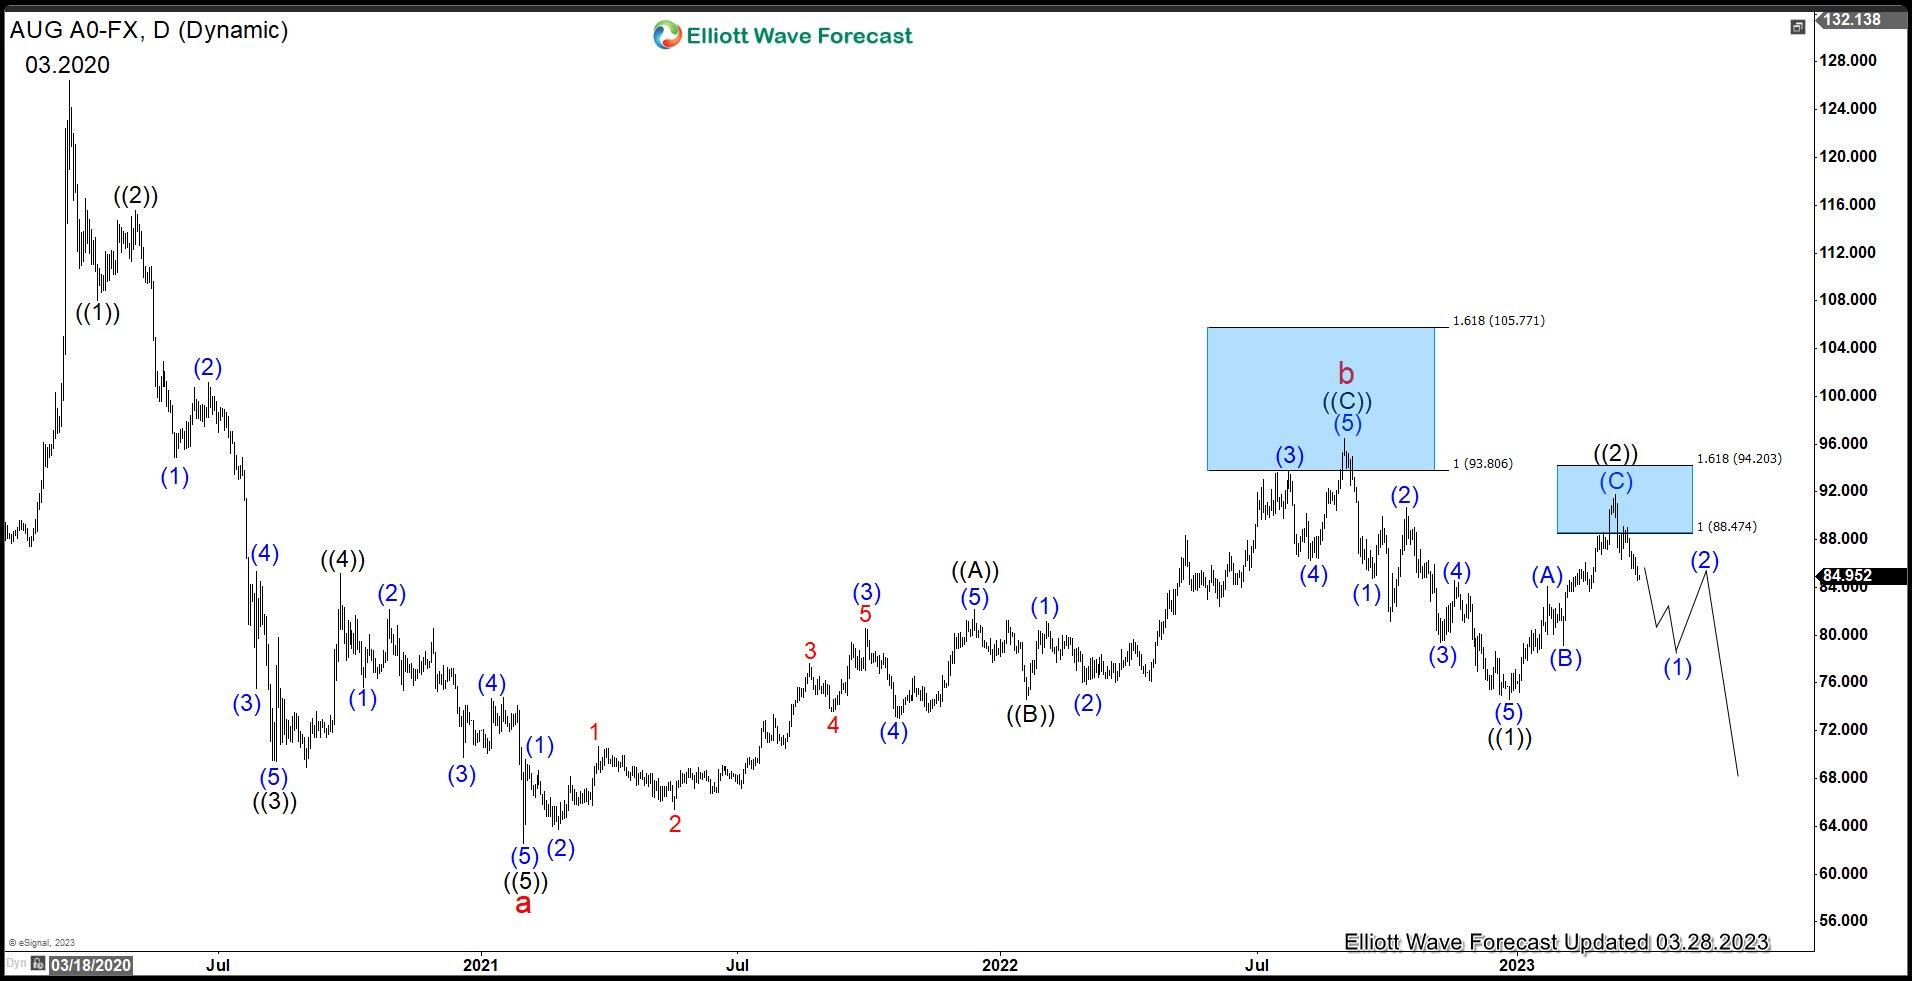
Gold-to-Silver ratio (AUG) daily chart above shows the decline from March 2020 high is in 5 waves impulse and ended wave a at 62.51. It then did a 3 waves zigzag corrective rally. Up from wave a, wave ((A)) ended at 82.13 and pullback in wave ((B)) ended at 74.65. Last leg wave ((C)) ended at 96.49 which completed wave b. It completed the corrective rally at the 100% – 161.8% fibonacci extension of wave ((A)).

The ratio has turned lower in wave C. Down from wave b, wave ((1)) ended at 74.63. Corrective rally in wave ((2)) has also ended at 91.81 as a 3 swing zigzag. It ended the correction also at the extreme blue box area. The ratio has turned lower and we should expect it to continue lower in months to come.

Author

Elliott Wave Forecast Team

Elliott Wave Forecast Team

ElliottWave-Forecast.com

More from Elliott Wave Forecast Team
Share:

Markets move fast. We move first.

Orange Juice Newsletter brings you expert driven insights - not headlines. Every day on your inbox.

By subscribing you agree to our Terms and conditions.

Editor's Picks

EUR/USD retreats toward 1.1700 on modest USD recovery

EUR/USD stays under mild bearish pressure and trades below 1.1750 on Friday. Although trading conditions remain thin following the New Year holiday and ahead of the weekend, the modest recovery seen in the US Dollar causes the pair to edge lower. The economic calendar will not feature any high-impact data releases.

GBP/USD struggles to gain traction, stabilizes near 1.3450

After testing 1.3400 on the last day of 2025, GBP/USD managed to stage a rebound. Nevertheless, the pair finds it difficult to gather momentum and trades marginally lower on the day at around 1.3450 as market participants remain in holiday mood.

Gold climbs toward $4,400 following deep correction

Gold advances toward $4,400 and gains more than 1.5% on the day after suffering heavy losses amid profit-taking heading into the end of the year. Growing expectations for a dovish Fed policy and persistent geopolitical risks seem to be helping XAU/USD stretch higher.

Cardano gains early New Year momentum, bulls target falling wedge breakout

Cardano kicks off the New Year on a positive note and is extending gains, trading above $0.36 at the time of writing on Friday. Improving on-chain and derivatives data point to growing bullish interest, while the technical outlook keeps an upside breakout in focus.

Economic outlook 2026-2027 in advanced countries: Solidity test

After a year marked by global economic resilience and ending on a note of optimism, 2026 looks promising and could be a year of solid economic performance. In our baseline scenario, we expect most of the supportive factors at work in 2025 to continue to play a role in 2026.

Crypto market outlook for 2026

Year 2025 was volatile, as crypto often is.  Among positive catalysts were favourable regulatory changes in the U.S., rise of Digital Asset Treasuries (DAT), adoption of AI and tokenization of Real-World-Assets (RWA).