Gold Price Forecast: XAU/USD under pressure around fresh weekly lows

XAU/USD Current price: $2,877.59
- US President Donald Trump rectified tariffs will come into effect on March 4.
- The US will publish the January PCE Price Index on Friday.
- XAU/USD fell to fresh weekly lows, with another leg south likely.
Spot Gold trades near a fresh weekly low of $2,867.76 on Thursday as risk aversion fueled demand for the safe-haven US Dollar (USD) across the Forex board. The United States (US) released relevant macroeconomic data, which fell short of impressive.
On the one hand, the US confirmed the annualized Q4 Gross Domestic Product (GDP) at 2.3% in the second estimate of the figure, although quarterly Personal Consumption Expenditures Prices suffered an upward revision to 2.4% from the previous estimate of 2.3%, and the core PCE prices were even higher, hitting 2.7% from the previous 2.5%.
On the other hand, Initial Jobless Claims rose to 242K in the week ended February 22, much higher than the 221K anticipated by market players. Also, Durable Goods Orders were up 3.1% in January, beating expectations of 2%. Finally, Pending Home Sales fell by 4.6% in the same month, much worse than the -1.3% expected.
However, what actually triggered fears was US President Donald Trump. After suggesting tariffs on Canada and Mexico will start in April on Wednesday, Trump rectified himself and clarified levies will go into effect on March 4 as scheduled. He also added an additional 10% tariff on China on the same date and said that reciprocal tariffs would come into effect on April 2.
Other than that, the US will publish on Friday the January Personal Consumption Expenditures (PCE) Price Index, the Federal Reserve’s (Fed) favorite inflation gauge. The PCE Price Index is foreseen up 0.3% on a monthly basis and by 2.5% from a year earlier.
XAU/USD short-term technical outlook
The daily chart for the XAU/USD pair shows an increased bearish potential, as it is breaking below a bullish 20 Simple Moving Average (SMA), the first time below it since January 7. The pair remains far above bullish 100 and 200 SMAs, yet technical indicators maintain their firmly bearish slopes, approaching their midlines from above.
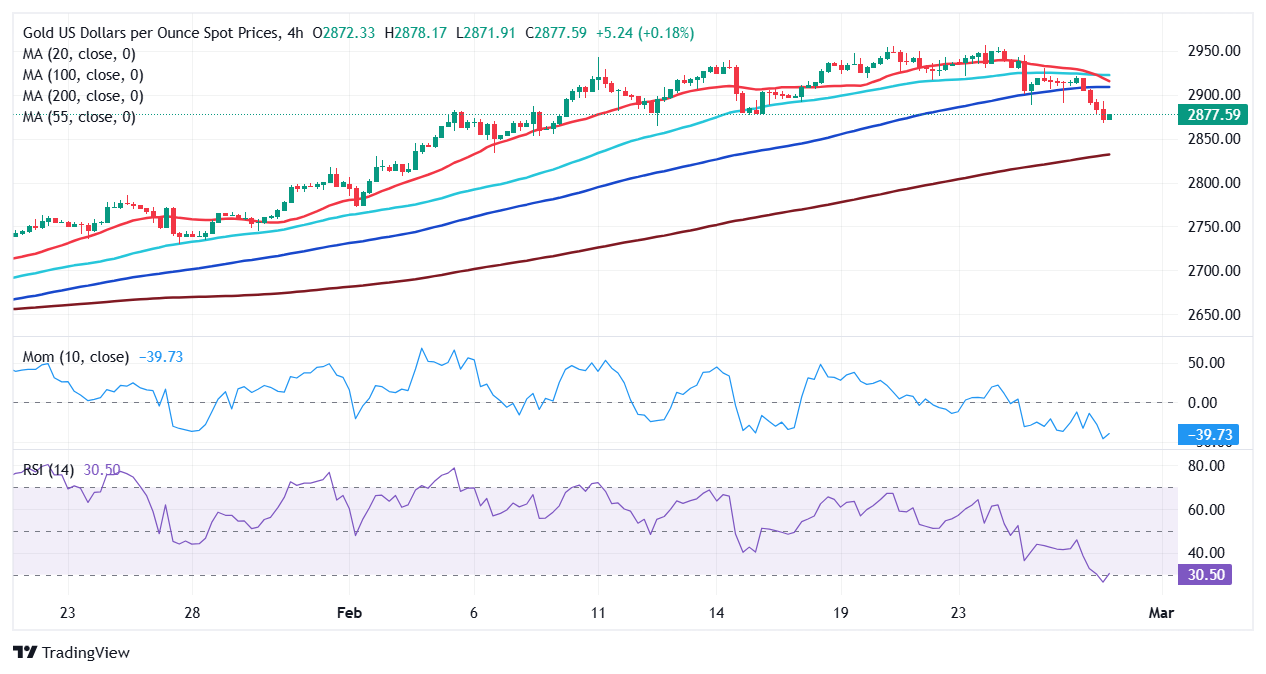
In the near term and according to the 4-hour chart, XAU/USD extended its slide below the 20 and 100 SMAs, with the shorter gaining downward traction above the longer one. Technical indicators, in the meantime, have resumed their slides near oversold readings, maintaining a strong bearish momentum and anticipating lower lows ahead.
Support levels: 2,867.70 2,852.90 2,839.10
Resistance levels: 2,894.80 2,907.60 2,925.60
Premium
You have reached your limit of 3 free articles for this month.
Start your subscription and get access to all our original articles.
Author

Valeria Bednarik
FXStreet
Valeria Bednarik was born and lives in Buenos Aires, Argentina. Her passion for math and numbers pushed her into studying economics in her younger years.


