Gold Price Forecast: XAU/USD hovers around $2,640 without directional strength

XAU/USD Current price: $2,641.31
- Upbeat United States data fueled demand for the USD in a risk-averse environment.
- Investors await US employment-related updates ahead of the NFP release next Friday.
- XAU/USD trades with a soft tone, but holds within familiar levels.
Resurgent US Dollar strength weighed modesty on Gold price, with XAU/USD posting intraday losses. The pair hovers around $2,640 in the American session and aims to extend its slump following better-than-anticipated United States (US) data.
S&P Global released the final estimate of the November Manufacturing Purchasing Manager Index (PMI), upwardly revised to 49.7 from the preliminary estimate of 48.8. The official ISM Manufacturing PMI for the same month printed at 48.4, better than the 47.5 expected and the previous 46.5.
Meanwhile, Wall Street trades mixed, with the Dow Jones Industrial Average down over 100 points, but the S&P500 and the Nasdaq Composite up for the day. The sentiment soured on weekend news, pointing to political turmoil in France and mounting tensions between the US and Russia after President-elect Donald Trump threatened to impose tariffs on BRICS countries over the weekend.
Attention this week will be on US employment data, as the country will release multiple job-related figures ahead of the Nonfarm Payrolls (NFP) report on Friday.
XAU/USD short-term technical outlook
From a technical point of view, XAU/USD remains confined to familiar levels, still struggling to find a directional way. In the daily chart, the pair struggles around a mildly bearish 20 Simple Moving Average (SMA) while the 100 and 200 SMAs maintain their bullish slopes well below the current level. Technical indicators, however, have turned flat at around their midlines, in line with the absence of a clear trend.
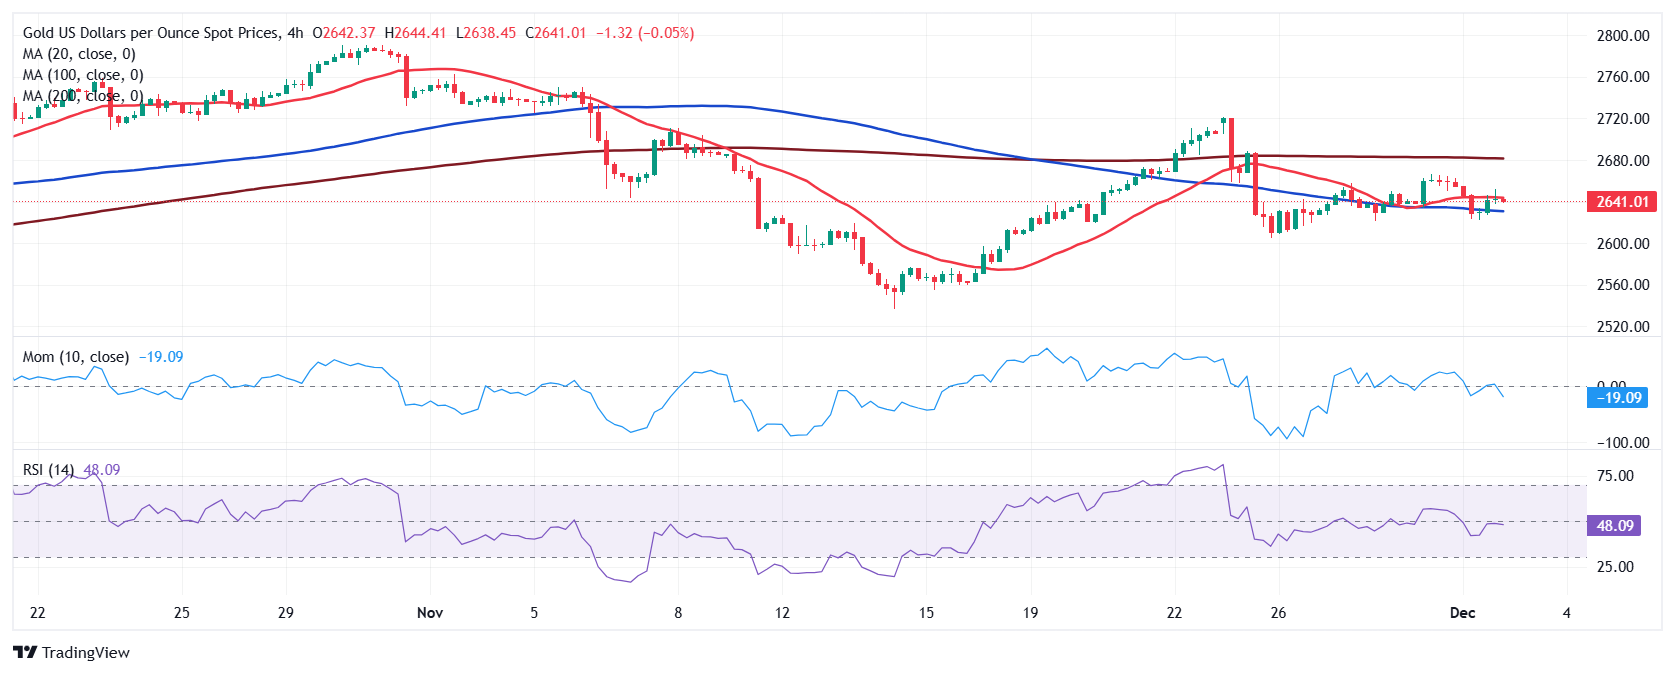
In the near-term, and according to the 4-hour chart, XAU/USD is neutral-to-bearish the bright metal stands below a flat 20 SMA while above an also directionless 100 SMA not far below the shorter one. The 200 SMA, in the meantime, stands in the $2,690 region, providing dynamic resistance. Finally, technical indicators turned lower around their midlines, lacking momentum enough to support a bearish continuation.
Support levels: 2,626.70 2,611.35 2,598.70
Resistance levels: 2,643.30 2,655.00 2,671.55
Premium
You have reached your limit of 3 free articles for this month.
Start your subscription and get access to all our original articles.
Author

Valeria Bednarik
FXStreet
Valeria Bednarik was born and lives in Buenos Aires, Argentina. Her passion for math and numbers pushed her into studying economics in her younger years.


