Gold Price Forecast: XAU/USD extends slide below $3,200 aims for lower lows

XAU/USD Current price: $3,187.31
- Risk appetite eased, but investors keep dropping safe-haven assets.
- Thursday will bring some interesting macroeconomic figures from major economies.
- XAU/USD trades at fresh one-month lows, aiming to extend its near-term slide.
Gold prices are down on Wednesday with the bright metal trading at its lowest since mid-April. The XAU/USD pair accelerated its slide during American trading hours, piercing the $3,200 mark, as investors keep moving away from safe-haven assets. Despite risk appetite receding on Wednesday, investors are less concerned about global growth and a potential United States (US) recession, given the de-escalation of trade tensions between the US and China.
Meanwhile, speculative interest kept digesting US inflation data. The slight uptick in the Consumer Price Index (CPI) in April reminded investors of the “hawkish” Federal Reserve’s stance. As a result, Wall Street trades mixed, with the Nasdaq Composite and the S&P 500 posting modest intraday advances and the Dow Jones Industrial Average (DJIA) down for a second consecutive day.
Data-wise, the macroeconomic calendar remained scarce, but Thursday will bring Australian monthly employment figures, an update on the United Kingdom (UK) Gross Domestic Product, and the US April Producer Price Index (PPI).
XAU/USD short-term technical outlook
From a technical point of view, the daily chart for the XAU/USD pair shows it fell further below a now flat 20 Simple Moving Average (SMA), while technical indicators resumed their slides within negative levels, in line with another leg lower. The 100 and 200 SMAS keep advancing, yet are too far below the current level to be relevant.
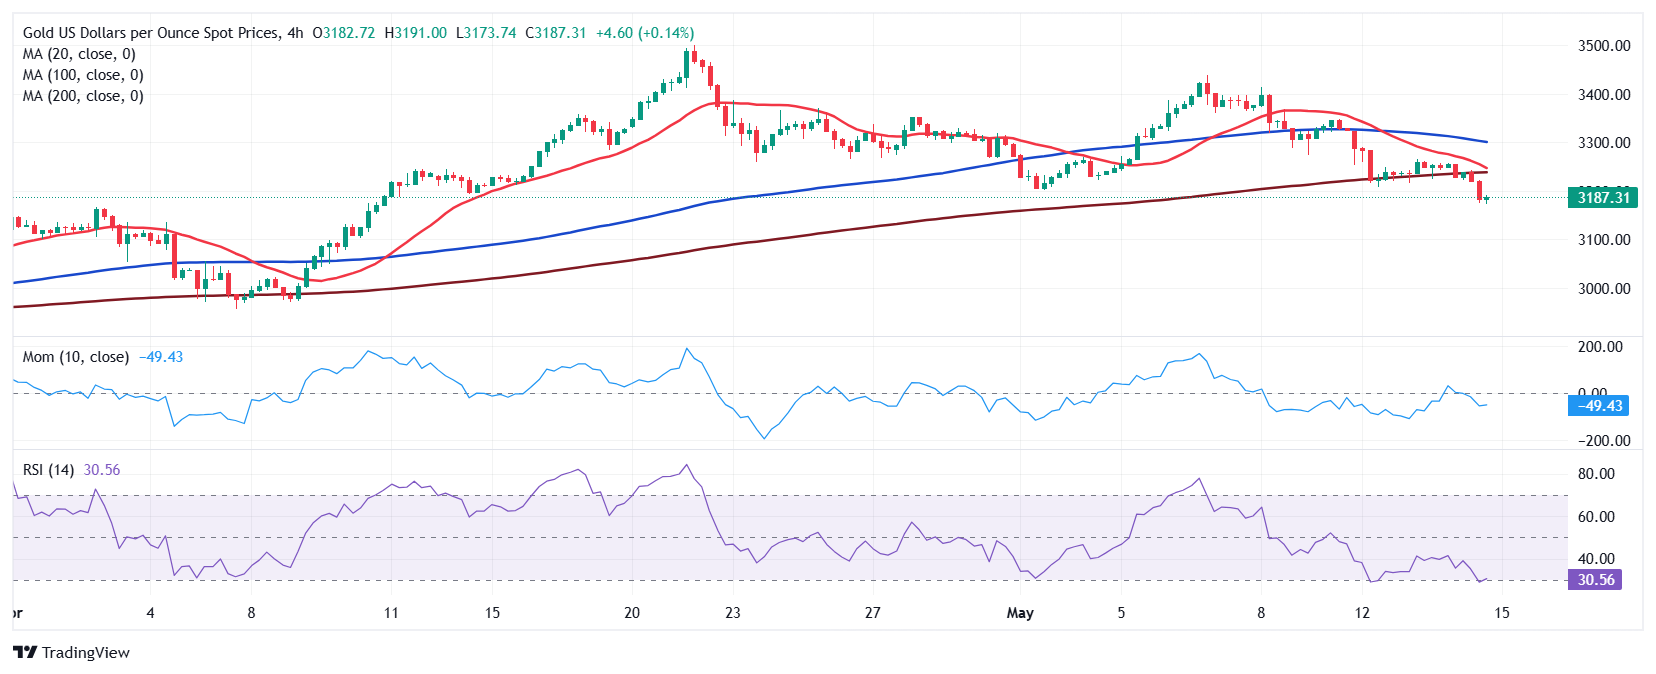
In the near term, and according to the 4-hour chart, XAU/USD is bearish. The pair trades below all its moving averages, with the 20 SMA about to cross below the 200 SMA. The latter stands at $3,232, providing relevant resistance in the case of a recovery. Finally, technical indicators lack directional strength but hold within negative levels, reflecting the absence of buying interest.
Support levels: 3,173.80 3,158.40 3,142.65
Resistance levels: 3,198.20 3,215.80 3,232.10
Premium
You have reached your limit of 3 free articles for this month.
Start your subscription and get access to all our original articles.
Author

Valeria Bednarik
FXStreet
Valeria Bednarik was born and lives in Buenos Aires, Argentina. Her passion for math and numbers pushed her into studying economics in her younger years.


