Gold Price Forecast: XAU/USD battles to retain the $3,300 mark

XAU/USD Current price: $3,309.10
- US employment and growth data missed expectations, spurring risk aversion.
- Inflation in the United States, as measured by the PCE index, eased in March.
- XAU/USD turned neutral in the near term, bearish potential remains well-limited.
Spot Gold fell throughout the first half of the day, extending its intraday slump to a fresh weekly low of $3,267.01. The XAU/USD pair traded on sentiment, falling after the release of tepid United States (US) data.
On the one hand, the April ADP Employment Change report showed that the private sector added measly 62K new job positions, much worse than the 108K expected, while below the previous 147K. On the other hand, the preliminary estimate of the US Q1 Gross Domestic Product (GDP) also missed expectations, as the economy contracted at an annualized pace of 0.3% against the anticipated 0.4% expansion, and sharply down from the previous 2.4%.
Wall Street fell as an immediate reaction to the news, with the US Dollar (USD) reacting unevenly across the FX board, gaining ground against commodity-linked currencies and the bright metal.
However, stocks quickly changed course, and so did XAU/USD, as the US March Personal Consumption Expenditures (PCE) Price Index brought some optimism. PCE inflation was up 0.5% on a monthly basis and 2.3% from a year earlier, slightly above expectations yet shrinking from the February levels. At the time being, US indexes remain in the red, but are well off early lows. While the USD came under selling pressure.
The upcoming Asian session will bring the Bank of Japan's (BoJ) monetary policy decision. Japanese officials are likely to keep interest rates on hold amid trade-war-related uncertainties. The Japanese yen (JPY) is likely to turn south with the expected decision and a suspected downgrade to economic prospects, which could result in an extra near-term USD impulse.
XAU/USD short-term technical outlook
The XAU/USD pair recovered the $3,300 mark and currently hovers around $3,310, with the upside limited. In the daily chart, the pair trades above all its moving averages, with a bullish 20 Simple Moving Average (SMA) providing relevant dynamic support at around $3,230. The 100 and 200 SMAs advance below it, while technical indicators extend their slides within positive levels, suggesting buyers remain sidelined.
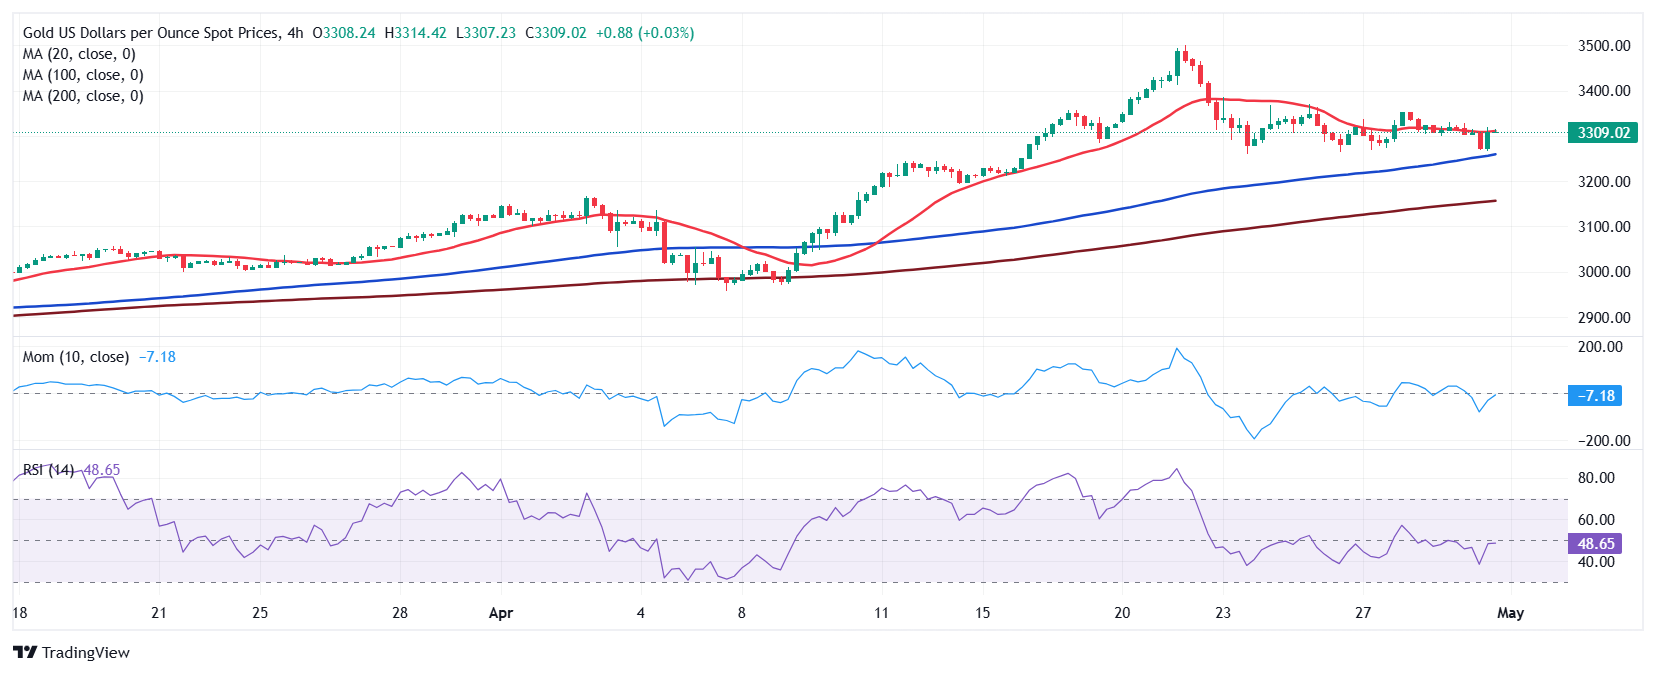
In the near term, and according to the 4-hour chart, the XAU/USD pair is neutral. The bright metal hovers around a directionless 20 SMA, although the longer moving averages advance below the mentioned intraday low, suggesting a limited bearish potential. Finally, technical indicators turned flat at around their midlines, failing to provide clear directional clues.
Support levels: 3,301.40 3,288.70 3,267.00
Resistance levels: 3,327.90 3,344.60 3,358.10
US-China Trade War FAQs
Generally speaking, a trade war is an economic conflict between two or more countries due to extreme protectionism on one end. It implies the creation of trade barriers, such as tariffs, which result in counter-barriers, escalating import costs, and hence the cost of living.
An economic conflict between the United States (US) and China began early in 2018, when President Donald Trump set trade barriers on China, claiming unfair commercial practices and intellectual property theft from the Asian giant. China took retaliatory action, imposing tariffs on multiple US goods, such as automobiles and soybeans. Tensions escalated until the two countries signed the US-China Phase One trade deal in January 2020. The agreement required structural reforms and other changes to China’s economic and trade regime and pretended to restore stability and trust between the two nations. However, the Coronavirus pandemic took the focus out of the conflict. Yet, it is worth mentioning that President Joe Biden, who took office after Trump, kept tariffs in place and even added some additional levies.
The return of Donald Trump to the White House as the 47th US President has sparked a fresh wave of tensions between the two countries. During the 2024 election campaign, Trump pledged to impose 60% tariffs on China once he returned to office, which he did on January 20, 2025. With Trump back, the US-China trade war is meant to resume where it was left, with tit-for-tat policies affecting the global economic landscape amid disruptions in global supply chains, resulting in a reduction in spending, particularly investment, and directly feeding into the Consumer Price Index inflation.
Premium
You have reached your limit of 3 free articles for this month.
Start your subscription and get access to all our original articles.
Author

Valeria Bednarik
FXStreet
Valeria Bednarik was born and lives in Buenos Aires, Argentina. Her passion for math and numbers pushed her into studying economics in her younger years.