Gold Price Forecast: XAU/USD battles a critical Fibonacci level around $3,325

XAU/USD Current price: $3,349.02
- US Consumer Price Index came in line with expectations, but higher than previous.
- United States President Donald Trump demanded lower interest rates again.
- XAU/USD pressures fresh weekly lows and a critical Fibonacci support.
Spot Gold remains spent the first half of the day hovering around the $3,350 level, seesawing around it without finding a clear way. The market sentiment was also volatile, reflecting uncertainty and keeping the XAU/USD pair in a range.
Things took a turn after the release of United States inflation data, as the US Dollar (USD) surged following the release of the June Consumer Price Index (CPI). Inflation resulted in line with the market’s expectations, up 2.7% on a yearly basis, meeting expectations yet above the 2.4% posted in May. The monthly increase was 0.3%, also aligned with the market’s forecast, yet above the 0.1% previous. Finally, the core annual reading increased by 2.9%, up from May’s 2.8% rise, while the core monthly reading printed at 0.2%.
Persistent inflationary pressures weighed on Federal Reserve (Fed) interest rate cuts odds, but the market was able to support it. What investors could not bear was yet another United States (US) President Donald Trump on social media, claiming “Consumer Prices LOW. Bring down the Fed Rate, NOW!!!” and another one demanding interest rate cuts: “Fed should cut Rates by 3 Points. Very Low Inflation. One Trillion Dollars a year would be saved!!!”
The Dow Jones Industrial Average (DJIA) and the S&P 500 turned sharply lower, reflecting market concerns, while the heavy tech-weighted Nasdaq remained afloat. Demand for the American currency, in the meantime, pushed XAU/USD towards the current $3,320 region.
XAU/USD short-term technical outlook
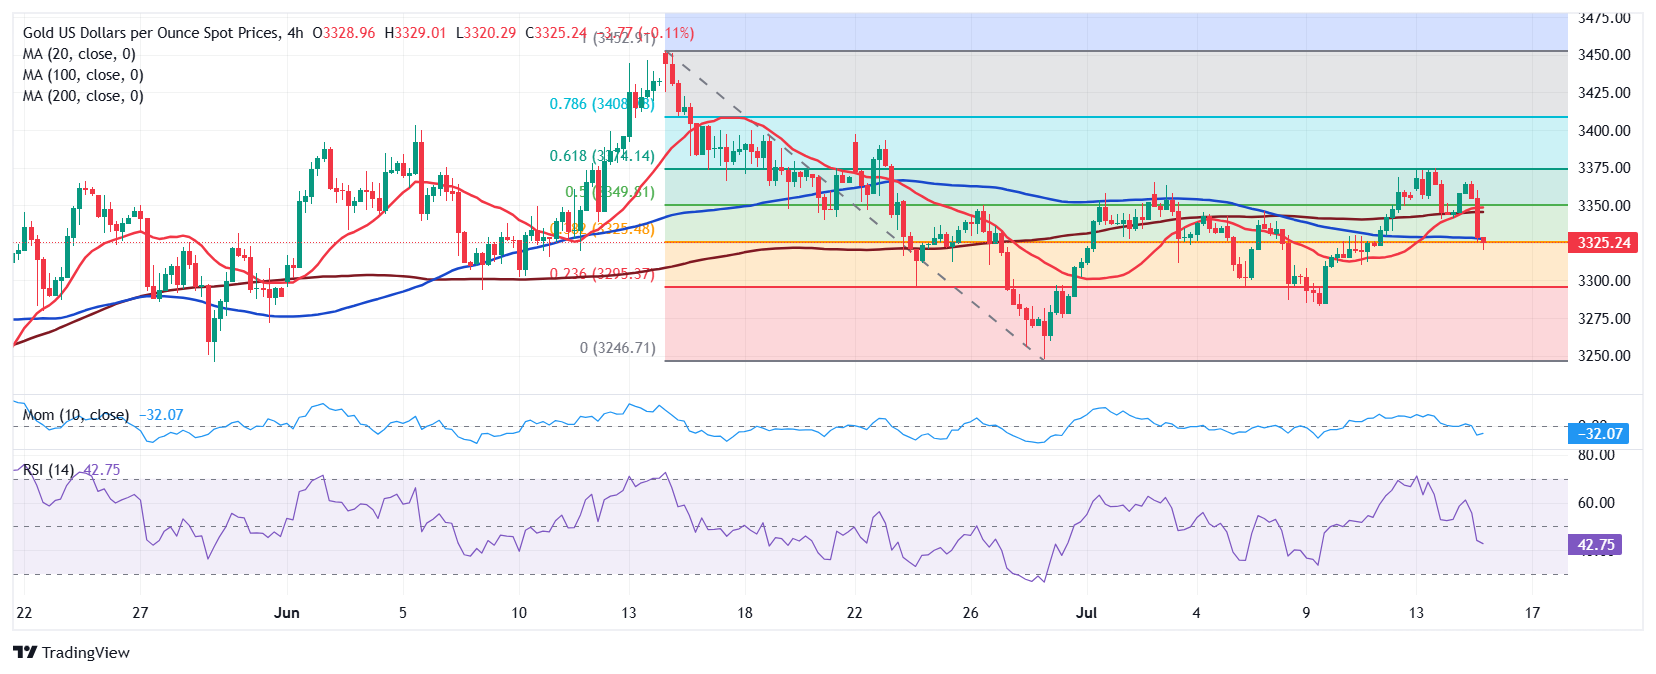
The XAU/USD pair fell towards the 38.2% Fibonacci retracement of its June slide measured between $3,452.51 - $3,247.83, after meeting sellers for a second consecutive day around the 61.8% retracement of the same decline at $3,374.56.
Technical readings in the daily chart offer a neutral-to-bearish stance, as the pair is also hovering around a mildly bearish 20 Simple Moving Average (SMA), while far above bullish 100 and 200 SMAs. Technical indicators, in the meantime, turned modestly lower within neutral levels, lacking enough strength to anticipate another leg south.
The near-term picture, however, is clearly bearish. The 20 SMA has lost its upward momentum and now converges with a flat 200 SMA, while the XAU/USD develops above them. It also fell below a now mildly bearish 100 SMA, adding to the odds for lower lows. Finally, technical indicators aim firmly south, the Momentum indicator piercing its midline, yet the Relative Strength Index (RSI) indicator is currently at around 43. The next Fibonacci support and the immediate bearish target is the 23.6% retracement at $3,295.50
Support levels: 3,311.70 3,295.50 3,282.60
Resistance levels: 3,350.18 3,374.56 3,390.10
Premium
You have reached your limit of 3 free articles for this month.
Start your subscription and get access to all our original articles.
Author

Valeria Bednarik
FXStreet
Valeria Bednarik was born and lives in Buenos Aires, Argentina. Her passion for math and numbers pushed her into studying economics in her younger years.


