Gold outlook: Diving into the Fed’s decision and Core PCE rates

Gold’s price appears to have moved relatively lower since the start of the week, yet that is not a surprise as thin trading conditions currently apply . In today’s report, we intend to have a look at the release of the Fed’s interest rate decision, the Core PCE rates and the recent geopolitical developments in Syria. For a rounder view, we conclude the report with a technical analysis of gold’s daily chart.
Diving into the Core PCE rates and the Fed’s decision last week
The US Core PCE rates for the month of November were released last Friday, with the rates coming in lower than expected. In particular, the Core PCE rate on a yoy level came in at 2.8% versus the expected rate of 2.9% which still tended to imply stubborn inflationary pressures in the US economy but failed to showcase an acceleration. In turn, the release may have allowed gold’s price to recoup some of its losses following the Fed’s interest rate decision, as it could open the door for the Fed to take a slightly more dovish stance. However, as we just mentioned, gold’s price faced severe downwards pressures following the Fed’s interest rate decision which also occurred last week. The Fed cut interest rates by 25 basis points, as it was widely expected, yet in their summary of economic projections, policymakers are expecting roughly 50 basis points in total when referring to potential rate cuts next year. Moreover, some policymakers are now taking into consideration president-elect Trump’s economic policies and their potential future impact on the Fed’s mandate to bring inflation down to 2%. Overall, it appears that the Fed is gearing up for a battle against inflation with the new year and thus appears to have adopted a more hawkish rhetoric which in turn may have aided the greenback whilst weighing on the precious metal’s price given the two’s inverse relationship with one another. In our view, we have repeatedly stressed our concerns about the possible resurgence of inflation with the president-elect's economic policies and thus, we would not be surprised to see the Fed adopt a much more gradual rate cutting approach in 2025. Furthermore, we would not be surprised to see the Fed opt for a cut from May onwards, as it could allow for a clearer picture to be formed on the new administrations actual economic polices rather than comments made potentially to gain negotiation leverage with foreign counterparts.
Geopolitics in 2025
In the Middle East continue to monitor the situation in Syria appears to have calmed down, with the same being said for Lebanon. It is our view, that the geopolitical narrative may shift to Asia in 2025, as the US Foreign policy agenda is also set to shift to that region with the Trump administration. In particular, we remain vigilant in regards to developments between China and Taiwan, whilst at the same time, we opt to monitor the disputed territory in the Himalayas between India and China. Although, we would keep a close eye in Syria, as the Kurdish forces backed by the Americans appear to be gearing up for hostilities with Turkey and their rebel backed organisation in Syria.
Technical analysis
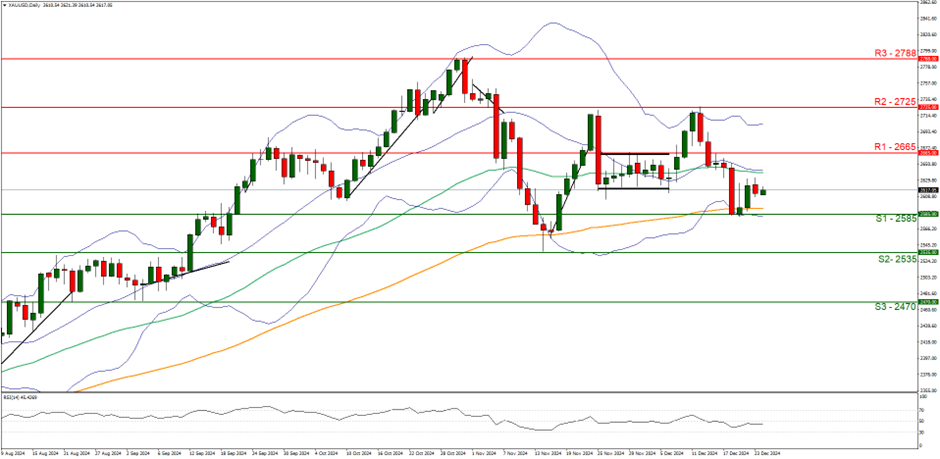
XAU/USD daily chart
Support: 2585(S1), 2535(S2), 2470(S3).
Resistance: 2665 (R1), 2725 (R2), 2788 (R3).
On a technical level, gold’s price appears to be moving in a relatively sideways motion. As this will be our last report for the year, we have opted to adjust our support and resistance levels in order to accommodate unforeseen events over the holidays. Nonetheless, we opt for a sideways bias for the precious metal’s price and supporting our case is the RSI indicator below our chart which currently registers a figure near 50, implying a neutral market sentiment. Moreover, with the holiday’s now upon us thin trading conditions may apply and thus in the event of an unforeseen situation, it could lead to heavy volatility in the markets. For our sideways bias, we would require the precious metal’s price to remain confined between the 2585 (S1) support level and the 2665 (R1) resistance line. On the flip side for a bearish outlook we would require a clear break below the 2585 (S1) support level, with the next possible target for the bears being the 2535 (S2) support base. Lastly, for a bullish outlook we would require a clear break above the 2665 (R1) resistance line with the next possible target for the bulls being the 2725 (R2) resistance level.
Author

Phaedros Pantelides
Independent Analyst
Mr Pantelides has graduated from the University of Reading with a degree in BSc Business Economics, where he discovered his passion for trading and analyzing global geopolitics.


