Holiday liquidity fuels a risk-on and debasement mix
- Holiday liquidity kept volatility low (VIX in the low teens) as US100 held higher, supporting carry trades but leaving positioning fragile into auctions or surprise headlines.
- The curve stayed the key anchor: U.S. 10Y near 4.17% and 10–2 around +31bp, keeping front-end stress contained and allowing softer USD alongside firm equities and metals.
- Venezuela-linked risk and broader uncertainty lifted gold above $4,500 and kept silver bid, while the USD’s haven bid faded as flows preferred real-asset hedges over cash.
- US growth stayed firm (Q3 GDP revised to 4.3% annualized), equities held record territory and rates stayed contained, so the USD softened versus high-beta FX as carry stayed supported.

Theme of the Day
Today’s regime is a classic late-December contradiction that actually makes sense once you identify the steering variable: not “risk-on vs risk-off,” but “liquidity + curve control.” With many markets on holiday schedules and early closes, price discovery gets thinner, and the market expresses macro preferences through the most liquid proxies: mega-cap equities, the dollar index, and precious metals.
In that environment, the same tape can print record equities and record gold because positioning is chasing convexity: upside in equities if growth holds, and insurance in metals if geopolitics and policy credibility risks flare.
What changed in the last 24 hours is the mix of strong activity data with no corresponding surge in rates. The U.S. economy’s Q3 growth was revised up to a 4.3% annualized pace, reinforcing the earnings durability narrative that keeps US index multiples supported into year-end.
At the same time, the curve did not reprice into a tighter-for-longer shock. With the U.S. 10Y hovering around 4.17% and the 10–2 spread positive around +31bp, the market’s “price of money” signal is that policy is restrictive but not accelerating tighter. That combination is exactly what allows the dollar to soften while equities hold up.
Gold ripping through $4,500 is the tell that this is not a clean growth party; it is a growth party with an insurance premium. The rally has been explicitly tied to haven demand from Venezuela-related tensions and to expectations of further Fed easing, with gold up roughly 70% this year and silver up about 150% (a 1979-style annual profile).
In other words: the macro market is buying both “earnings” and “debasement/hedge” at the same time, and thin liquidity amplifies that dual-track behavior.
Cross-asset dashboard
Rates are confirming the theme rather than fighting it: U.S. 10Y near 4.17% and a positive 10–2 spread around +31bp tell you the curve is not screaming fresh front-end tightening risk, which keeps USD funding stress muted and lets risk assets breathe.
Central banks are not driving with live decisions today (holiday calendar), so narrative power shifts to expectations and to Japan’s minutes as a volatility trigger for JPY crosses in thin conditions.
Equities are behaving like a low-vol carry product: S&P 500 and Nasdaq remained supported and the volatility complex stayed suppressed (VIX around 14), which is consistent with systematic flows staying engaged.
Commodities split into “hedge” and “macro”: gold at record highs signals elevated tail-risk hedging, while oil is left to inventory data and geopolitical headlines, meaning any supply narrative can punch above its weight in thin liquidity.
Macro Catalysts That Moved Price
US100 (H4): Growth optimism plus holiday liquidity keeps the grind higher
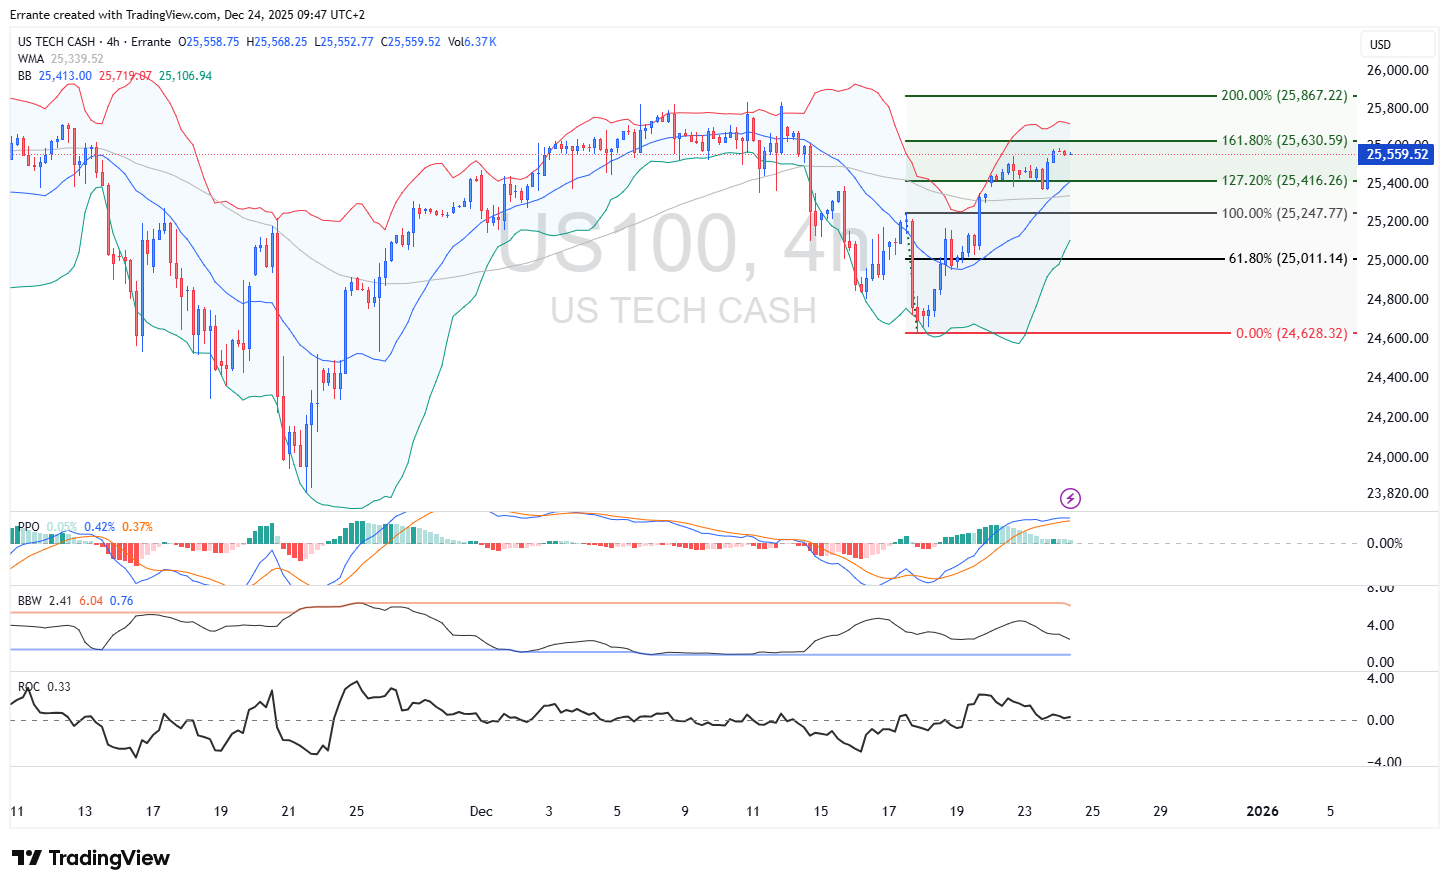
Markets repriced the probability of a clean year-end melt-up rather than a macro shock: equities stayed supported while vol stayed low, consistent with mechanical year-end allocation flows.
On the chart, US100 is holding 25,559 with price back above the 127.2% extension at 25,416 and pressing into the 161.8% zone at 25,631; the next upside magnet is the 200% extension near 25,867.
Momentum confirms the grind: PPO is positive (histogram above zero) and ROC is modestly positive (0.33), which fits a controlled trend rather than a blow-off. Volatility compression is visible via BBW (current ~2.41 versus a prior spike), suggesting the market is trending with tight risk premia, not panicking.
The tactical risk is asymmetric: in thin liquidity, a sharp downside can appear without warning. A clean H4 failure back below 25,416 would shift the bias from “buy dips” to “respect mean reversion,” with 25,248 then 25,011 as the next structural levels.
DXY (H4): Dollar weakness expresses “curve comfort” more than “growth fear”
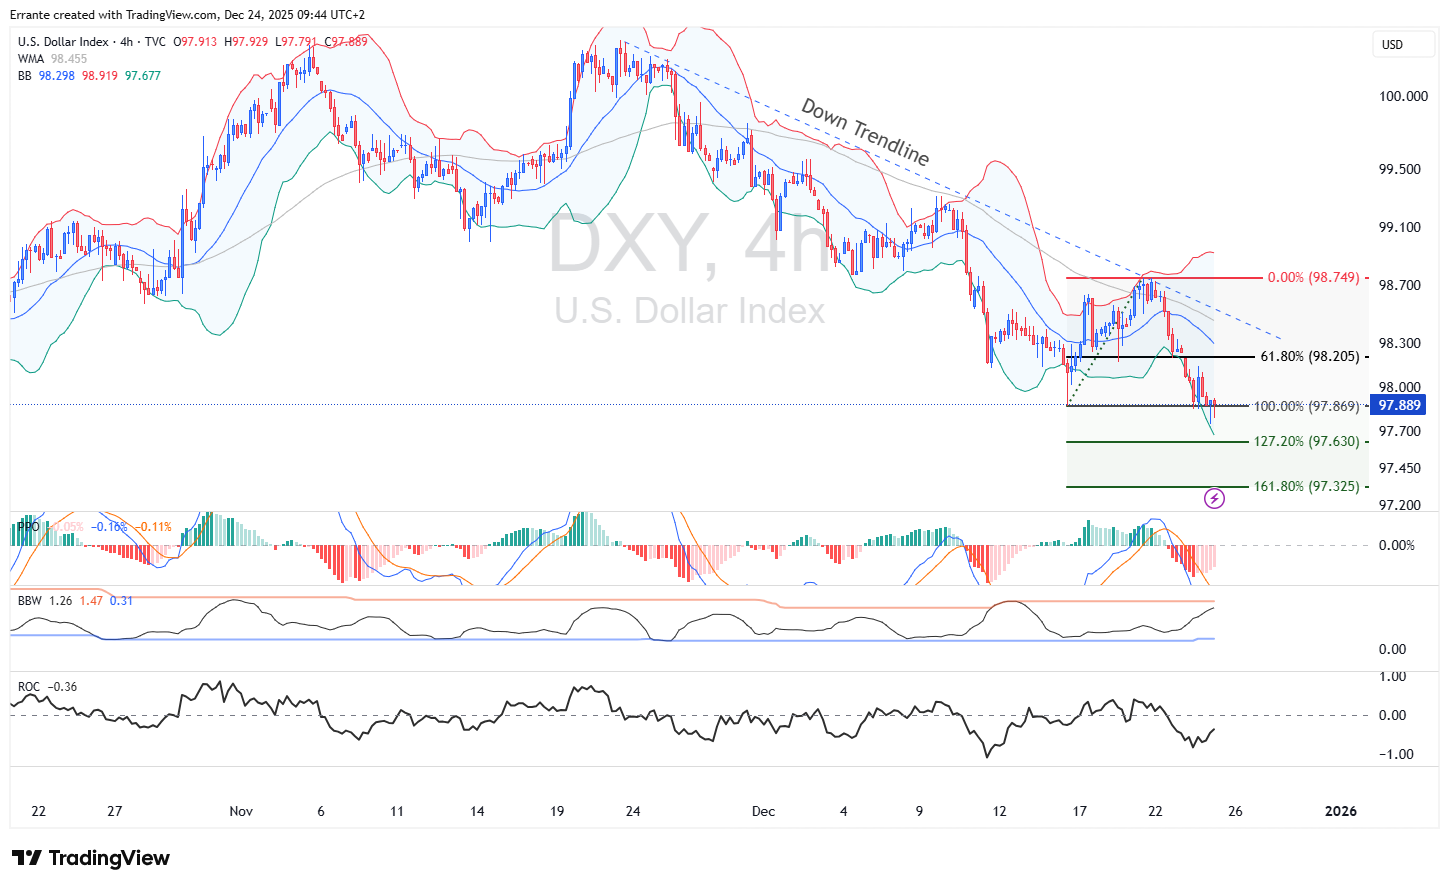
The dollar is losing altitude because strong growth did not translate into a higher “price of money” shock. With the curve not repricing sharply tighter, the USD’s relative-rate advantage does not widen further, and the market can rotate into risk and real assets.
Technically, DXY is trading around 97.889 and has broken below the 100% retracement marker at 97.869, keeping the near-term structure bearish under the downtrend line. The next downside checkpoints are 97.630 (127.2%) and 97.325 (161.8%).
Momentum supports the move: PPO readings are slightly negative and ROC is also negative (-0.36), consistent with a drift lower rather than a violent washout.
Resistance is now layered at 98.205 (61.8%) and 98.749 (0%), and any recovery that stalls below those levels keeps the “sell-rallies” framework intact.
What to watch next is not a headline, it is the plumbing: the 7-year auction and any unexpected jump in yields that forces dollar-covering.
VIX (H4): Volatility remains the quiet enabler, but the setup is fragile
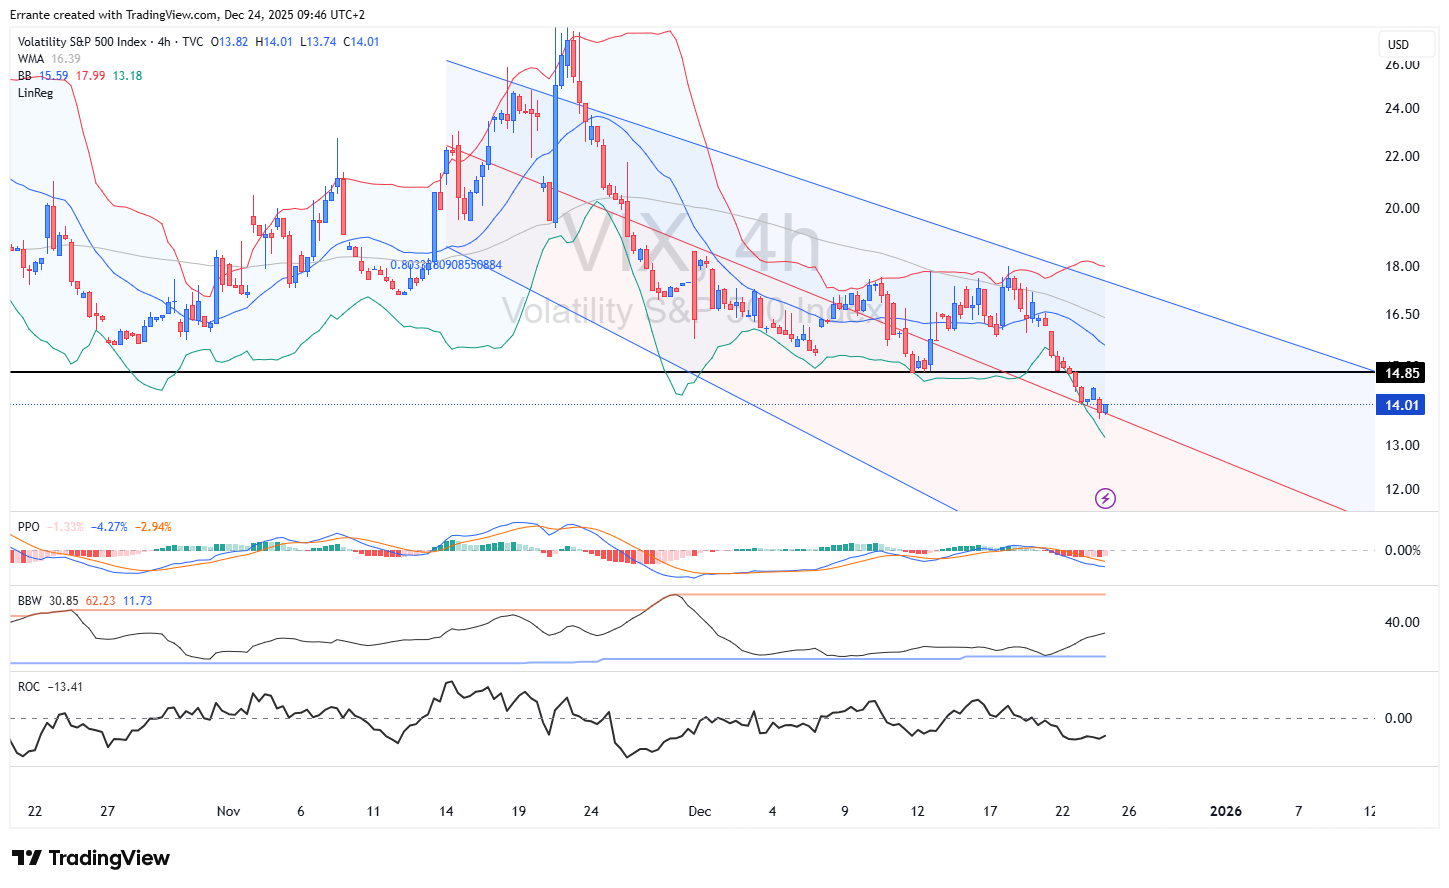
The market is pricing calm; VIX is around 14.01 and remains below its 16.39 WMA, consistent with stable risk appetite and suppressed hedging demand into the holiday.
On the chart, volatility is still contained within a downward channel, and the momentum suite is not threatening a reversal. PPO remains negative and ROC is deeply negative (-13.41), which typically aligns with “sell vol / buy dips” behavior in equities.
The level to respect is 14.85 (near the marked horizontal barrier); staying below it keeps the vol regime benign. A break above 14.85–15.6 would matter because it would likely coincide with a faster USD bounce and equity pullback, especially in thin liquidity where hedging flows can gap.
What to watch next is any catalyst that creates discontinuity rather than information: a poor Treasury auction (tail), a surprise in oil inventories that reframes supply risk, or an abrupt BoJ-minutes-driven move in JPY crosses that spills into global risk sentiment.
Gold: A record breakout signals hedging demand, not just momentum chasing
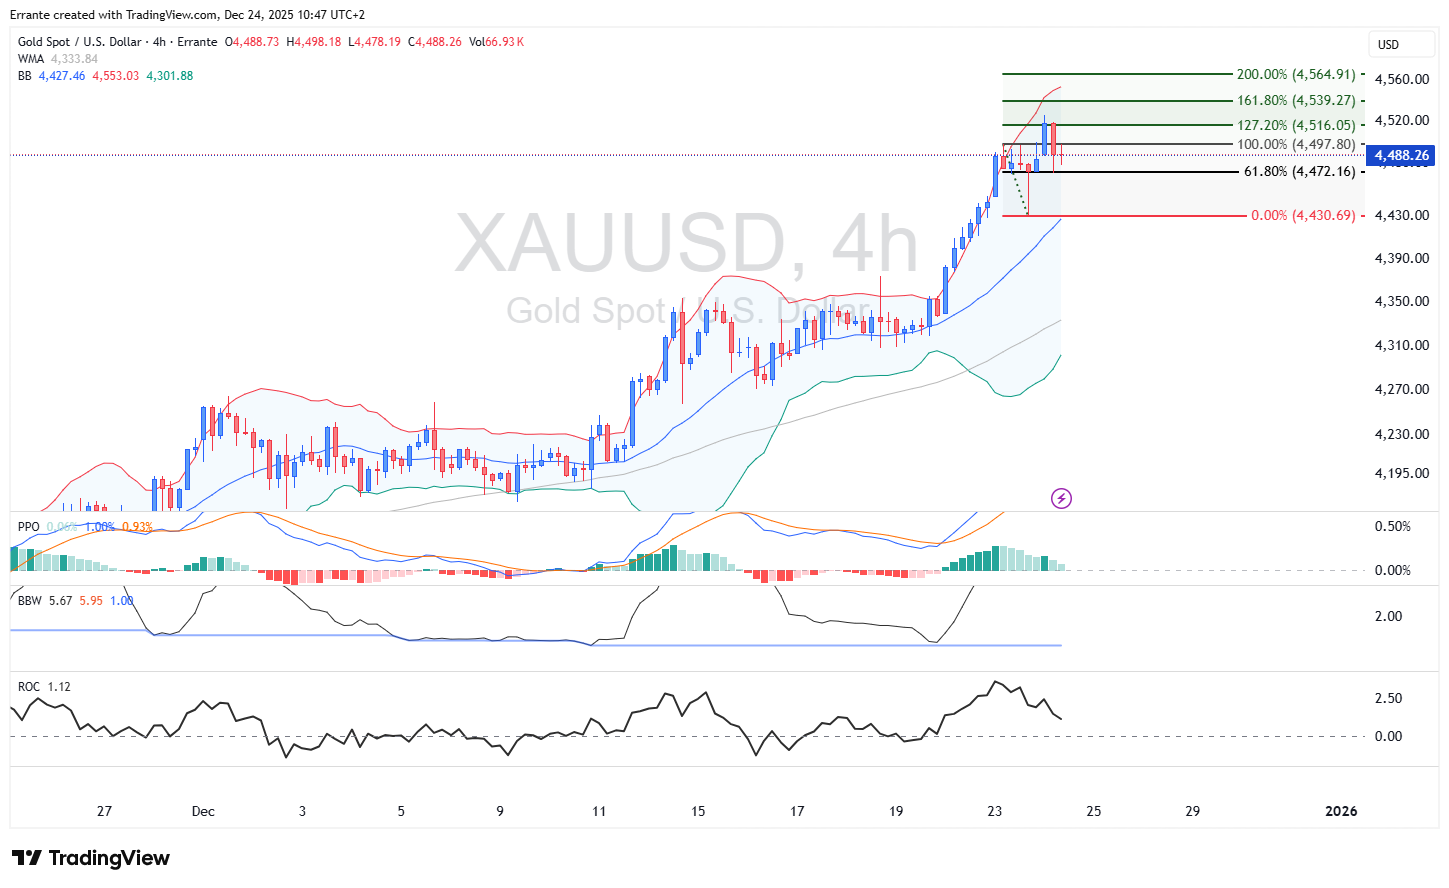
Gold above $4,500 is not a normal “risk-off” message because equities are also strong. It is a hedge against geopolitical and policy-credibility tails, reinforced by easing-cycle expectations and strong real-asset demand dynamics. The key macro mechanism is that haven demand is being expressed through metal rather than through cash USD, which fits today’s softer DXY.
Technically (even without today’s gold chart), the level that matters is behavioral. $4,500 is a psychological threshold that tends to attract both breakout continuation buying and profit-taking. The market has already demonstrated it can absorb pullbacks and re-accelerate, which increases the odds that dips are bought as long as the geopolitical premium remains live.
What to watch next is the set of triggers that can change the real-yield impulse intraday. Treasury auction reception, any shift in rate-cut language from U.S. policymakers, and oil-related headlines that push inflation expectations higher (which can be gold-positive initially, but gold-negative if yields gap higher).
Bottom line
Base case for the next 24 hours: thin-liquidity conditions keep the “equities up, USD soft, gold supported” mix intact, with US100 biased to test 25,631 then 25,867 while DXY risks extending toward 97.63 if yields stay contained.
Alternative scenario: a rates-driven shock (auction tail or surprise yield jump) forces a quick USD rebound and equity de-risking, most likely visible first through VIX breaking above 14.85–15.6 and DXY reclaiming 98.20.
Author

Ali Mortazavi
Errante
BEc, CMSA, Member of IFTA - International Federation of Technical Analysis, Associate Member of STA - Society of Technical Analysis (UK).


