GBP/USD Current Price: 1.3344

  • “Irrefutable” Brexit should get done, according to PM Johnson.
  • Preliminary December Markit PMI seen bouncing modestly, holding in contraction territory.
  • GBP/USD stabilized above 1.3300, retains its bullish stance.

The GBP/USD pair reached 1.3515 last Friday, a level last seen in May 2018, after UK PM Boris Johnson’s Conservative Party won the UK general election. The party got 364 seats, more than enough to pass the Brexit deal through the Parliament. Labours got just 203 seats, resulting in leader Jeremy Corbyn apologizing for the defeat and saying that he won’t lead his party into another election. PM Johnson said that Brexit is now “irrefutable” and should get done. There’s a good chance that PM Johnson will submit his deal to the Parliament before the year-end. The pair eased throughout Friday amid a resurgent dollar and profit-taking, ending the week with substantial gains above the 1.3300 threshold.

At the beginning of the week, the UK will release the December Rightmove House Price Index, while Markit will release the preliminary estimates of the UK Manufacturing PMI and Services PMI, seen slightly better than in November but still within contraction levels. Next Thursday, Queen Elizabeth will do the so-called Queen’s Speech and will detail all the bills the government plans to enact over the coming year.

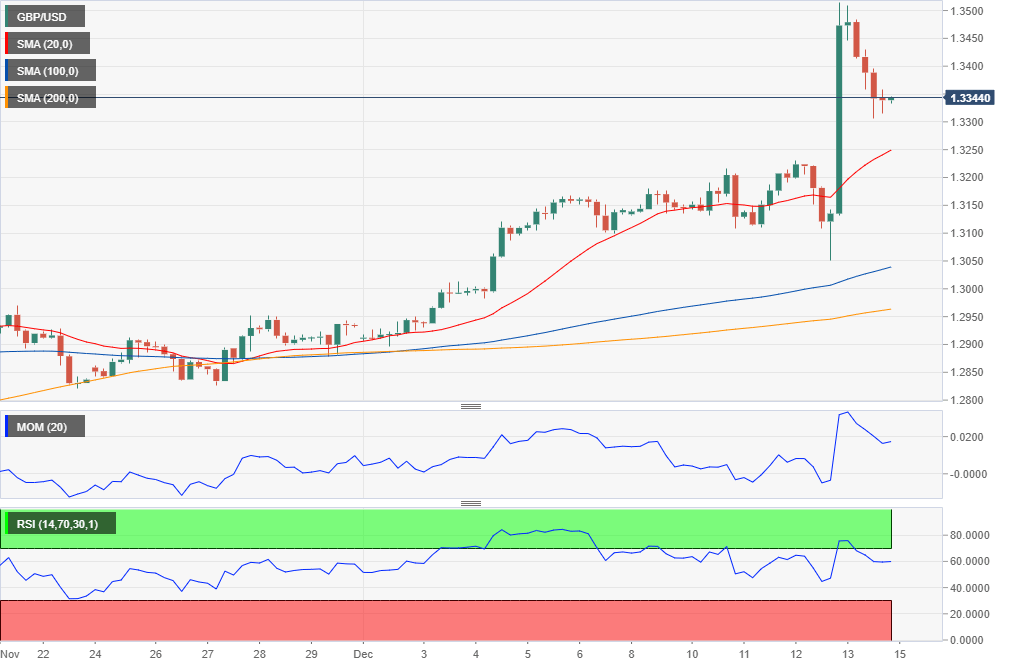
GBP/USD short-term technical outlook

The GBP/USD pair is bullish according to the daily chart, as, despite the sharp retracement from multi-month highs, the pair is trading around its former yearly highs. Technical indicators in the mentioned chart maintain their upward slopes within overbought levels, while the pair is further above a firmly bullish 20 DMA.  In the 4-hour chart, technical indicators retreated from extreme levels but stabilized well into positive ground, while the pair develops far above all of its moving averages, all of which skews the risk to the upside.

Support levels: 1.3305 1.3270 1.3225

Resistance levels: 1.3365 1.3400 1.3440

View Live Chart for the GBP/USD

Information on these pages contains forward-looking statements that involve risks and uncertainties. Markets and instruments profiled on this page are for informational purposes only and should not in any way come across as a recommendation to buy or sell in these assets. You should do your own thorough research before making any investment decisions. FXStreet does not in any way guarantee that this information is free from mistakes, errors, or material misstatements. It also does not guarantee that this information is of a timely nature. Investing in Open Markets involves a great deal of risk, including the loss of all or a portion of your investment, as well as emotional distress. All risks, losses and costs associated with investing, including total loss of principal, are your responsibility. The views and opinions expressed in this article are those of the authors and do not necessarily reflect the official policy or position of FXStreet nor its advertisers. The author will not be held responsible for information that is found at the end of links posted on this page.

If not otherwise explicitly mentioned in the body of the article, at the time of writing, the author has no position in any stock mentioned in this article and no business relationship with any company mentioned. The author has not received compensation for writing this article, other than from FXStreet.

FXStreet and the author do not provide personalized recommendations. The author makes no representations as to the accuracy, completeness, or suitability of this information. FXStreet and the author will not be liable for any errors, omissions or any losses, injuries or damages arising from this information and its display or use. Errors and omissions excepted.

The author and FXStreet are not registered investment advisors and nothing in this article is intended to be investment advice.

Recommended Content


Recommended Content

Editors’ Picks

AUD/USD could extend the recovery to 0.6500 and above

AUD/USD could extend the recovery to 0.6500 and above

The enhanced risk appetite and the weakening of the Greenback enabled AUD/USD to build on the promising start to the week and trade closer to the key barrier at 0.6500 the figure ahead of key inflation figures in Australia.

AUD/USD News

EUR/USD now refocuses on the 200-day SMA

EUR/USD now refocuses on the 200-day SMA

EUR/USD extended its positive momentum and rose above the 1.0700 yardstick, driven by the intense PMI-led retracement in the US Dollar as well as a prevailing risk-friendly environment in the FX universe.

EUR/USD News

Gold struggles around $2,325 despite broad US Dollar’s weakness

Gold struggles around $2,325 despite broad US Dollar’s weakness

Gold reversed its direction and rose to the $2,320 area, erasing a large portion of its daily losses in the process. The benchmark 10-year US Treasury bond yield stays in the red below 4.6% following the weak US PMI data and supports XAU/USD.

Gold News

Bitcoin price makes run for previous cycle highs as Morgan Stanley pushes BTC ETF exposure

Bitcoin price makes run for previous cycle highs as Morgan Stanley pushes BTC ETF exposure

Bitcoin (BTC) price strength continues to grow, three days after the fourth halving. Optimism continues to abound in the market as Bitcoiners envision a reclamation of previous cycle highs.

Read more

US versus the Eurozone: Inflation divergence causes monetary desynchronization

US versus the Eurozone: Inflation divergence causes monetary desynchronization

Historically there is a very close correlation between changes in US Treasury yields and German Bund yields. This is relevant at the current juncture, considering that the recent hawkish twist in the tone of the Federal Reserve might continue to push US long-term interest rates higher and put upward pressure on bond yields in the Eurozone. 

Read more

Majors

Cryptocurrencies

Signatures