Fed preview: Scope for aggressive balance sheet normalization
The Fed rate decision is due at 18:00GMT on September 20. The policy statement will be accompanied by Fed's latest economic projection and the 'dot plot' chart. At 18:30GMT, Fed Chair. Yellen will hold the press conference.
Market sees...
- No change in rates - No one expects the Fed to hike rates. If it does, it would be an absolute stunner, sending US yields and the USD higher across the board.
- Fed will begin the process of balance sheet normalization - This is going to take time... a long time, even if we assume there are no hiccups/economic shocks on the way. The Fed has said that whenever it begins with the balance sheet normalization process, it's going to trim the balance sheet by $10 billion a month for the first three months, $20 billion per month for the next three, and on and on until it hits a pace of $50 billion per month. Before it starts cutting, it would first stop reinvesting the maturity proceeds. Markets expect the Fed to start cutting the balance sheet from October/December, depending on how the markets and the economy react.
- Fed may drop hints about the Dec rate hike: The federal funds futures market at Friday's close showed a slightly less than 50% chance of another rate hike this year. The hint may come through policy statements and/or the dot plot chart.
- Less Dots in favor of another rate hike in 2017
Markets believe the 'dot plot' chart would show less support for December rate hike. In June, twelve of the sixteen dots had shown at least one more rate hike by the end of 2017. The committee is expected to signal a modestly flatter interest rate path and increased concern


Fed Live Coverage - Wednesday 20th - 17.45 GMT
What to expect during the Federal Reserve Monetary Council this time? FXStreet news, Valeria Bednarik and Yohay Elam live comments...
Scope for hawkish talk, aggressive balance sheet normalization
With stock markets at record highs and China reflation story gathering steam again, the Fed could get away with being much more aggressive about reducing the balance sheet.
- US inflation expectations are on the rise
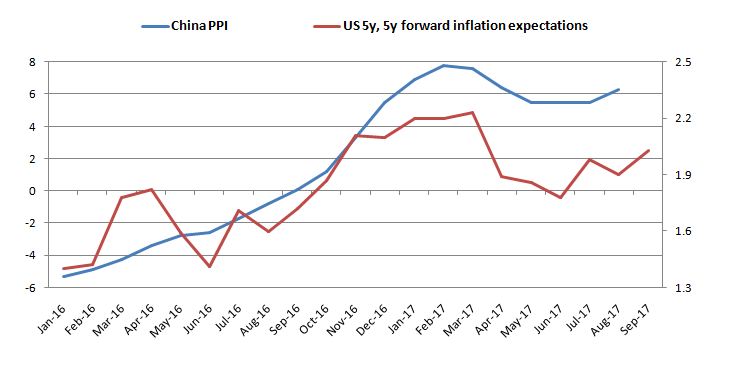
Data from Reuters
The chart above clearly shows, it was the Chinese PPI that set the ball rolling mid-2016. Chinese PPI and the US 5y,5y forward inflation expectations topped out in the first quarter.
Following the spike in the Chinese PPI in August, speculation is gathering pace that the world's second largest economy is reflating and shall end up pushing the US inflation expectations higher. The Fed's preferred gauge now stands at 1.4 percent and is likely to follow the rise in the Chinese PPI and US inflation expectations.
- Citi US Economic Surprise Index is least negative since May
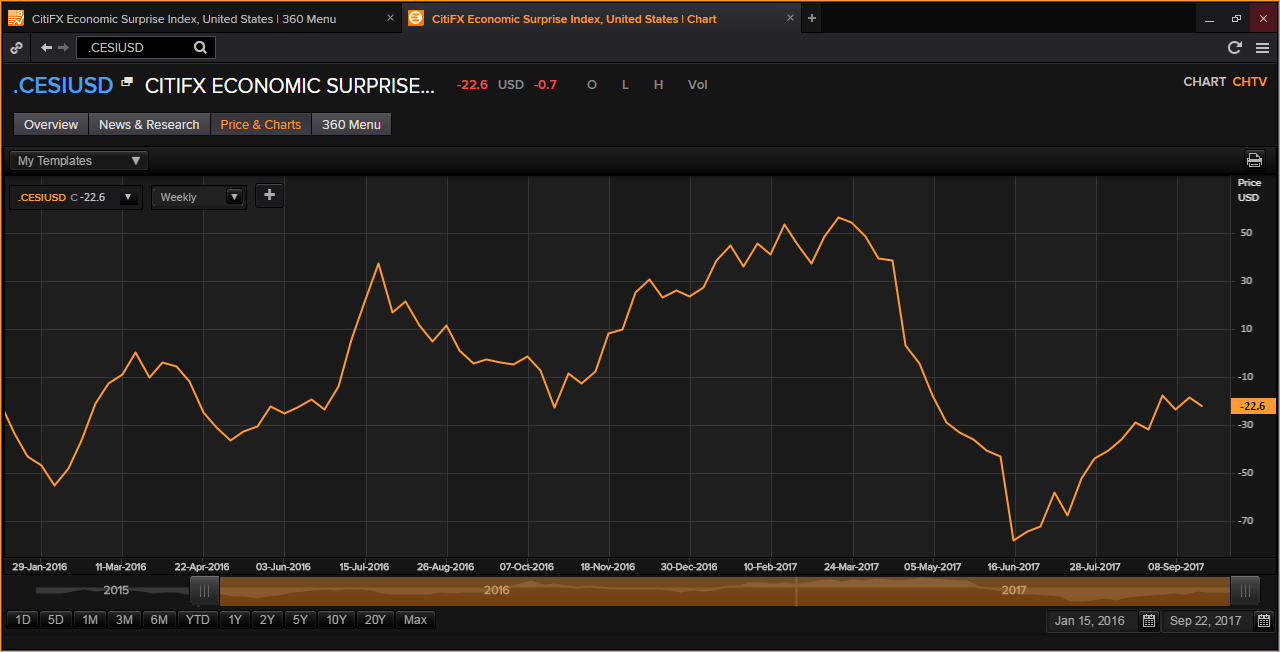
Citigroup's Economic Surprise Index, a widely followed indicator of how the data are performing up to expectations,topped out in the first quarter and plunged to below -70 levels in June.
It is worth noting that the economic surprise index is closely following the Chinese PPI and the US inflation expectations.
The index is now least negative since May. The rise from the June lows has been fuelled by improvement in the labour market and a bounce in manufacturing from a 'weaker dollar' and stronger global demand.
- USD sell-off has created enough room for faster normalization
The Dollar Index has dropped from 103.81 to 91.00 levels this year. As noted earlier, manufacturing has benefited from the weak dollar, while stocks are at record highs as well. Furthermore, oil is breaking higher and the China reflation story is gathering pace. The situation is ideal for the Fed to normalize the policy at a faster pace.
The hawkish surprise may come through in the form of-
- Strong December rate hike hits
- Dot plot chart
- Talk of faster balance sheet normalization
- Fed chair Yellen may downplay weak inflation and express concerns regarding the easing of financial conditions this year despite rate hikes
Strong hints of the December rate hike would shift focus back to the 2-year treasury yield from the 10-year yield. Thus, a flatter yield curve would once again become USD bullish.
USD/JPY - 115.00 likely on hawkish Fed
As discussed here, the price action on the monthly chart indicates the pair is set to test 115.00 levels.
Overbought Stochastics on the daily chart
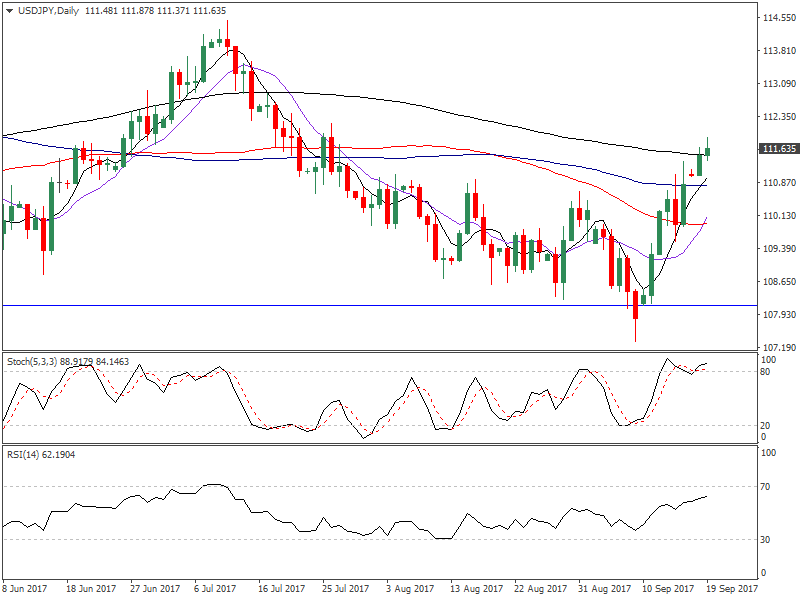
- The spot currently trades above the 200-DMA of 111.47. The 14-day RSI is above 50.00 and yet to hit the overbought territory. However, the Stochstics [5,3,3] is overbought, thus a minor pullback could be seen.
- Bulls have nothing to worry about unless the spot closes below the 10-DMA, which currently stands at 110.11.
Bank of Japan [BOJ] is not even close to considering QE taper or policy tightening. Thus, Yen is a sitting duck. Hawkish Fed talk could drive the spot higher to 115.00 levels. A dovish surprise may derail the rally, although only a daily close below 108.00 levels would revive the bearish view.
Yen crosses [AUD/JPY, EUR/JPY and GBP/JPY] may drop if the stock markets react negatively to Fed's reverse QE [balance sheet normalization].
GBP/USD - relatively resilient
As discussed on Friday, the markets are more likely to focus on the BOE rate hike talk. Fed tightening is old news and unless it talks about faster balance sheet normalization, the GBP/USD pair is likely to hold above 1.32 levels.
Cable could rally to 1.3835 levels if the Fed sounds dovish [flatter rate hike path/ no Dec rate hike hint/ delays balance sheet runoff].
Weekly chart
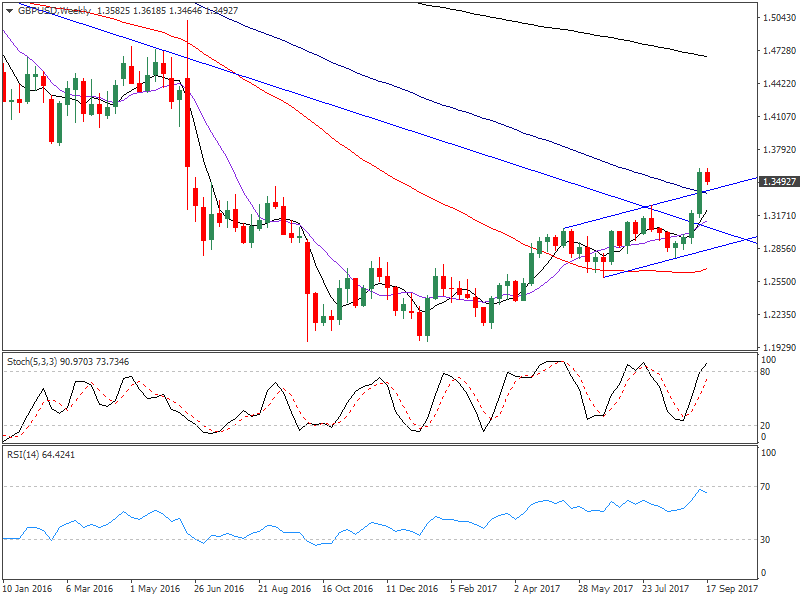
- The confluence of the downward sloping weekly 100-MA and the channel support is noted around 1.3380.
- On the higher side, 1.3835 [Feb 2016 low] is big level.
Author

Omkar Godbole
FXStreet Contributor
Omkar Godbole, editor and analyst, joined FXStreet after four years as a research analyst at several Indian brokerage companies.


