EUR/USD: the EU does not want an amicable Brexit

EUR/USD Current price: 1.0746
View Live Chart for the EUR/USD
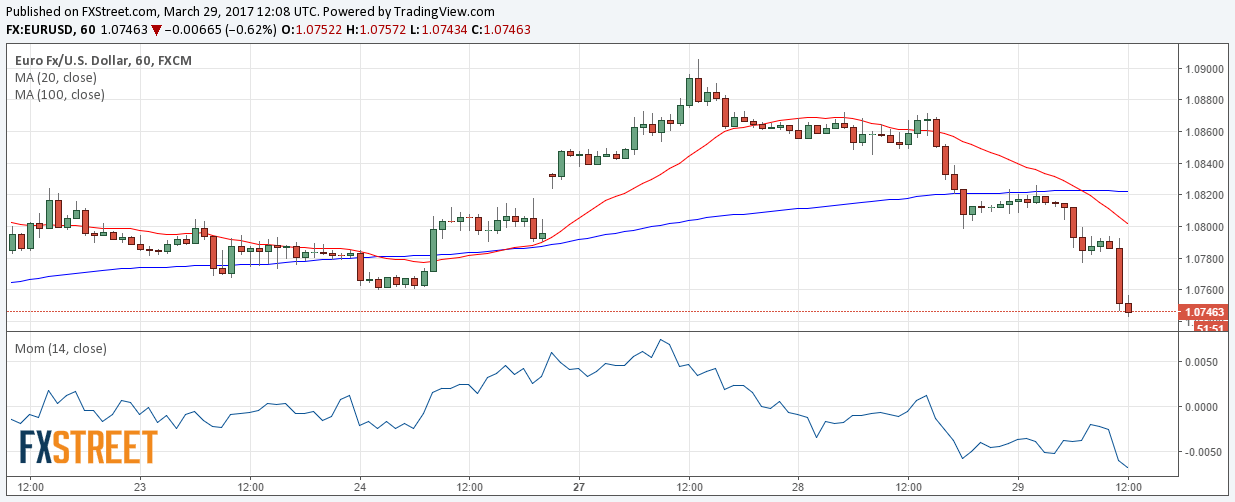
The EUR/USD pair is under heavy selling pressure, trading at its lowest in a week. The pair has fallen to 1.0739 and hovers a few pips above it on ECB's headlines, as a "source familiar with the matter" said that the bank has been over-interpreted at its latest meeting, as the reduced tail risk does not automatically implies the tapering of the ongoing stimulus programs. The dollar is getting some additional help from equities, up worldwide after Tuesday's impressive recovery.
Market players are focused purely on the ongoing split between the UK and the EU this Wednesday, as UK's PM Theresa May formally notified their decision of leaving the EU with a letter to the European Union. But a leaked copy of the EU's resolution on the matter shows that the Union, showed that Britain won't be given a free trade deal, and that the exit process can last no longer than three years. The document also makes a big point on the EU protecting its political, financial, and social interests.
The short term picture for the pair is clearly bearish, as in the 1 hour chart, technical indicators are barely easing their bearish momentum within extreme oversold territory, whilst the price has broken below all of its moving averages with the 20 SMA having crossed below the 100 SMA and about to extend below the 200 SMA. In the 4 hours chart, the bearish momentum coming from indicators is even stronger, while the 20 SMA is turning south far above the level. The pair has a major static support at 1.0735, and a stronger one around 1.0700. If this last gets broken, the decline could extend during the upcoming sessions down to 1.0590.
Support levels: 1.0735 1.0700 1.0670
Resistance levels: 1.0780 1.0825 1.0860
GBP/USD Current price: 1.2421
View Live Chart for the GBP/USD
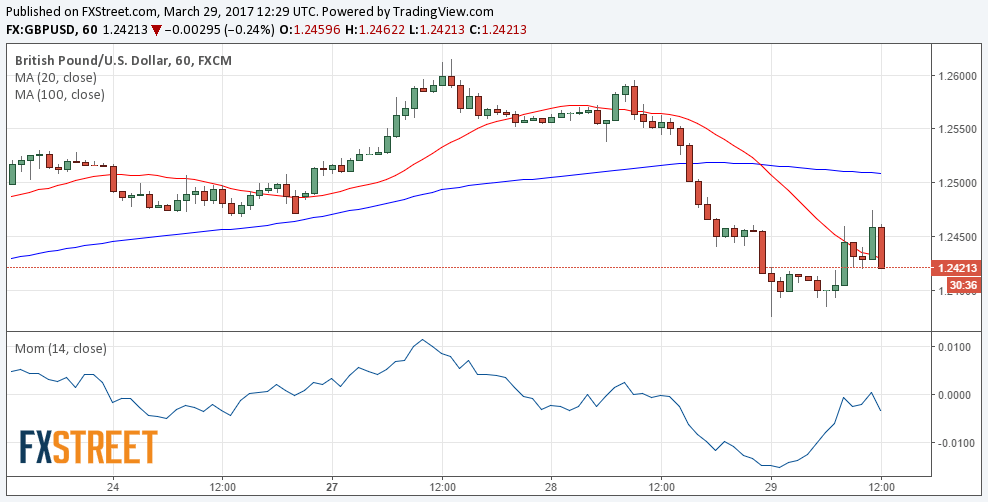
The GBP/USD pair bottomed at 1.2375 at the beginning of the day, recovering afterwards up to 1.2475, from where it's now falling back towards its daily lows. The Brexit announcement, alongside with Tuesday's news showing that the Scottish Parliament backed FM Sturgeon on the need for a second independent referendum, is keeping investors on their toes, resulting in wild swings one way and the other. Now dragging the pair lower are news that the EU won't make things ease for the UK, something largely commented on previous updates. Still, the speed of the Union's answer after PM May presented the letter, and the tough position they are taking, weigh on Pound. Technically, the price is struggling around a major Fibonacci level, the 38.2% retracement of the January rally, with the scale lean towards the downside, as the price is unable to settle clearly above a bearish 20 SMA, whilst technical indicators have corrected oversold conditions, but lost upward strength and turned lower after testing their mid-lines. In the 4 hours chart, the 20 SMA heads sharply lower above the current level, whilst technical indicators present a clear downward momentum below their mid-lines, supporting a bearish extension, moreover on a break below the 1.2400 figure.
Support levels: 1.2400 1.2370 1.2330
Resistance levels: 1.2465 1.2500 1.2530
USD/JPY Current price: 110.89
View Live Chart for the USD/JPY
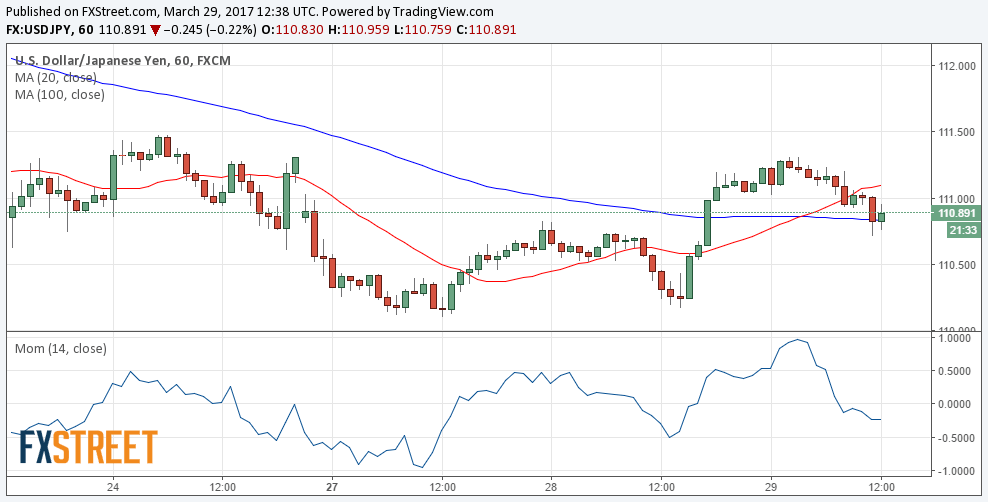
Bearish below 111.60, still yield-dependent. The USD/JPY pair extended its recovery up to 111.31 overnight, but retreated towards negative territory, as Treasury yields showed no follow-through after yesterday's recovery. News coming from Japan showed that Retail Sales rose by less than expected in February, indicating that the economy is still far from a recovery. The short term picture for the pair is still bearish, as in the 1 hour chart, the price is now aiming to break below its 100 SMA, whilst technical indicators head lower within negative territory. In the 4 hours chart, the Momentum indicator holds within positive territory, but turned flat, while the RSI indicator has resumed its decline now heading south around 46. In this last time frame, the 100 SMA has accelerated its slide below the 200 SMA, with both standing far above the current level. The bearish potential could ease only with a clear advance beyond 111.60, a strong static resistance.
Support levels: 110.70 110.25 109.90
Resistance levels: 111.10 111.60 112.00
AUD/USD Current price: 0.7653
View Live Chart for the AUD/USD
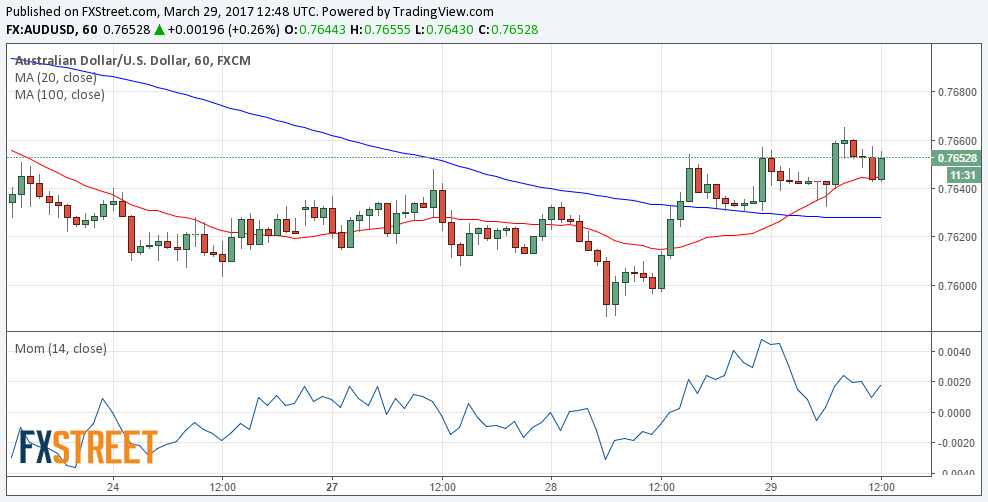
The AUD/USD pair trades within positive territory, advancing for a second consecutive day amid a recovery in equities, trading not far below its daily high of 0.7665. However, the upward strength is limited, after resurging dollar's demand at the beginning of the week. The short term picture favors additional gains, as in the 1 hour chart, the price is above a bullish 20 SMA whilst technical indicators have bounced from near their mid-lines, but remain below previous daily highs. In the 4 hours chart, the price is above a modestly bullish 20 SMA, whilst technical indicators advance above their mid-lines, although with limited upward strength, reflecting a cautious stance across the board.
Support levels: 0.7600 0.7570 0.7535
Resistance levels: 0.7665 0.7700 0.7740
Author

Valeria Bednarik
FXStreet
Valeria Bednarik was born and lives in Buenos Aires, Argentina. Her passion for math and numbers pushed her into studying economics in her younger years.


