EUR/USD Price Forecast: US Dollar collapse amid Trump trade war, European optimism

EUR/USD Current price: 1.0703
- Back and forth regarding United States tariffs' plan maintain the US Dollar in sell-off mode.
- German left parties about to form a coalition agreement to boost defence and infrastructure investment.
- EUR/USD soars to fresh 2025 highs, corrective declines may attract buyers.
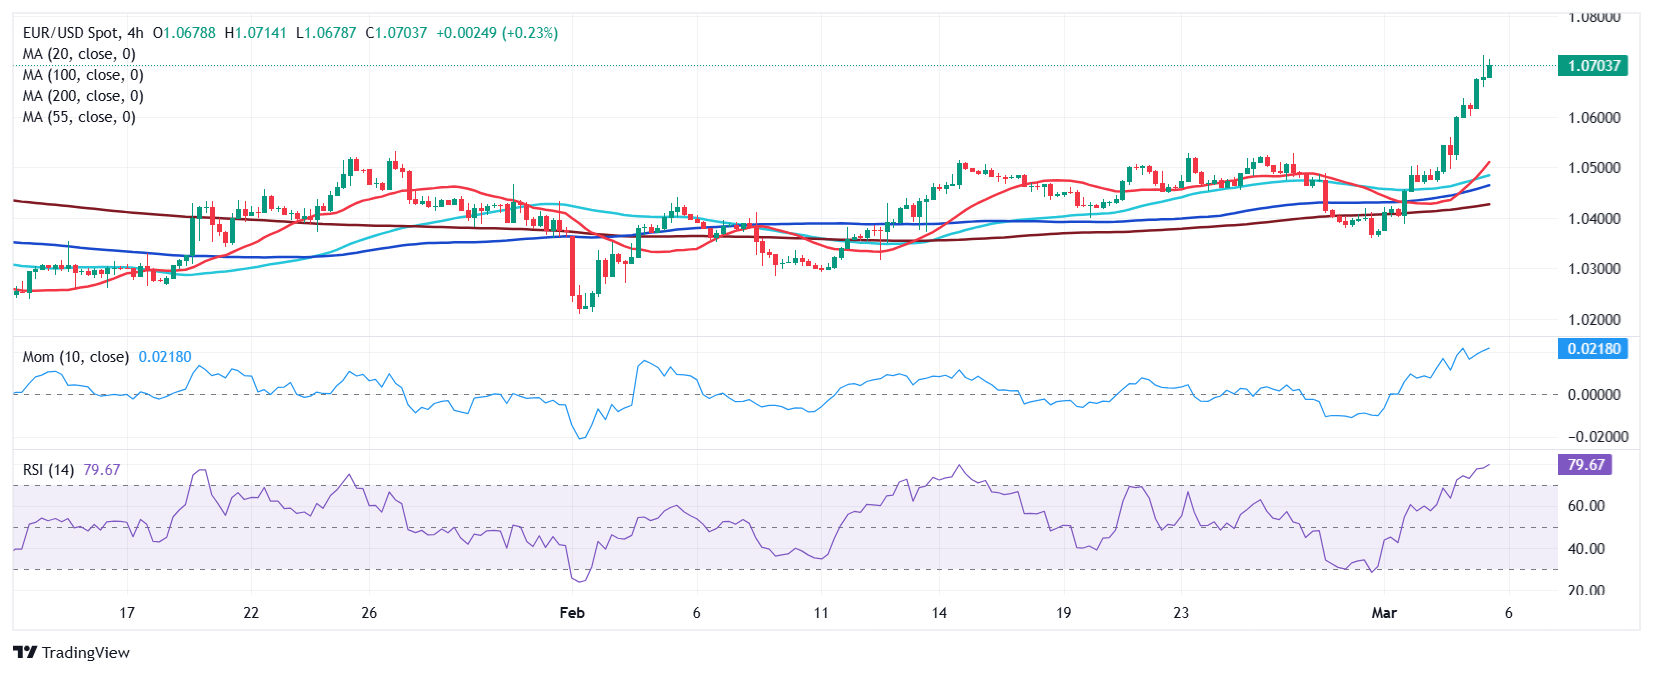
The EUR/USD pair traded as high as 1.0721 on Wednesday, which was last seen in November 2024. The US Dollar (USD) sell-off continued amid the trade war triggered by United States (US) President Donald Trump and fresh optimism.
The US government imposed levies of 25% on imports coming from Canada and Mexico on Tuesday while adding a 10% on Chinese goods to the 10% announced a month ago. China and Canada quickly announced retaliatory measures, while Mexican President Claudia Sheinbaum said countermeasures would be announced over the weekend.
However, financial markets turned optimistic ahead of Wednesday’s opening after US Commerce Secretary Howard Lutnick suggested Trump’s administration may reduce or even roll back tariffs on the two neighbouring countries.
At the same time, the Euro (EUR) found demand following encouraging political headlines. Following the recent elections in Germany, parties agreed on a financial package. Friedrich Merz, leader of the Christian Democrats (CDU), likely the next German Chancellor, along with the Christian Social Union (CSU), and the Social Democrats (SPD) announced plans to raise billions of euros to boost defence and infrastructure amid fears that the US will abandon the Western alliance.
The parties agreed that decisions to boost Germany's and European defence infrastructure "can no longer be postponed after the latest decisions of the American government," Merz said.
Data-wise, the Hamburg Commercial Bank (HCOB) released the final estimates of the European Services and Composite Purchasing Managers’ Index (PMI). German figures suffered downward revisions, while the final EU Services PMI was confirmed at 50.6 in February, slightly below the 50.7 previously estimated. The Composite PMI remained unchanged at 50.2.
Across the pond, the US published the ADP Employment Change report, which showed that the private sector added 77K new positions in February, much worse than the previous 183K or the expected 140K
Later in the day, the US will release January Factory Orders and the February ISM Services PMI. S&P Global, in the meantime, will publish the final estimates of its Services and Composite PMIs.
EUR/USD short-term technical outlook
The EUR/USD pair holds on to gains near the mentioned high, with the USD suffering additional pressure from poor employment-related figures. Technically, the daily chart shows that the pair met near-term sellers around the 200 Simple Moving Average (SMA) while rallying far above the 20 and 100 SMAs. The shorter one gains upward traction below the longer ones, not enough to confirm a long-term bullish continuation. Finally, technical indicators stand near overbought levels with uneven upward strength but show no signs of upward exhaustion, suggesting higher highs are still possible.
In the near term, and according to the 4-hour chart, EUR/USD is extremely overbought, and a corrective decline is not out of the picture, given that technical indicators are retreating modestly from their recent peaks. Still, the market mood indicates that declines could be short-lived and that buyers may take their chances on dips. Additionally, EUR/USD has run far above all its moving averages, with the 20 SMA turning firmly higher above the longer ones, reflecting prevalent buying interest.
Support levels: 1.0675 1.0630 1.0590
Resistance levels: 1.0725 1.0770 1.0815
Author

Valeria Bednarik
FXStreet
Valeria Bednarik was born and lives in Buenos Aires, Argentina. Her passion for math and numbers pushed her into studying economics in her younger years.