EUR/USD Price Forecast: Holding above 1.0800 with limited directional strength

EUR/USD Current price: 1.0824
- Manufacturing output in the Eurozone improved by more than anticipated in March.
- An upbeat market mood limits demand for the US Dollar.
- EUR/USD holds on to modest intraday gains, lacks directional momentum.
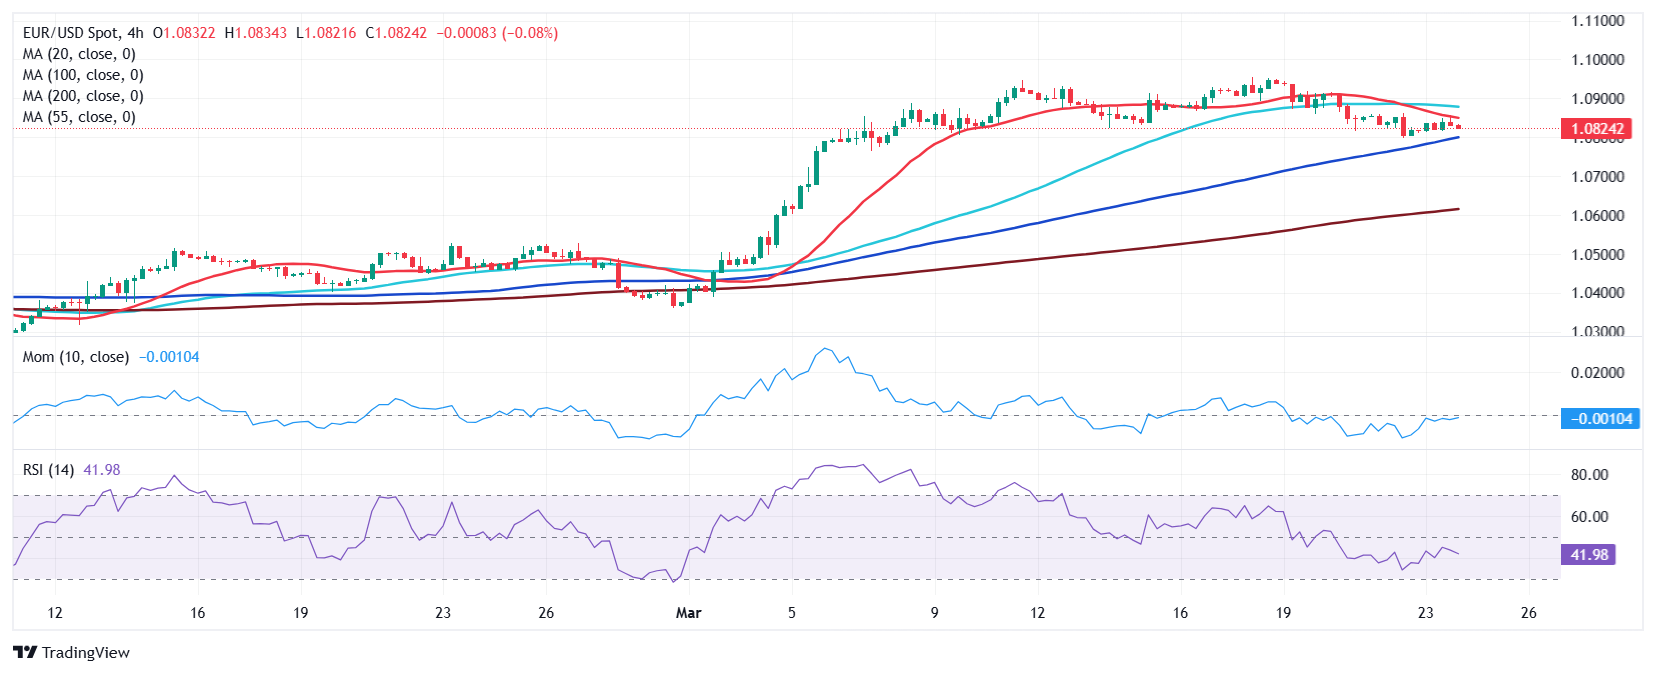
The EUR/USD pair traded as high as 1.0858 on Monday, recovering from Friday’s low at 1.0797. The market mood improved, resulting in US indexes jumping north ahead of the opening and weighing on the US Dollar (USD).
Meanwhile, the Euro (EUR) benefited from upbeat local data. The Hamburg Commercial Bank (HCOB) released the preliminary estimates of the March Purchasing Managers’ Index (PMI). “German business activity rose at the quickest rate for ten months in March, amid a first increase in manufacturing production for almost two years,” according to the official report, with the manufacturing index printing at 48.3, up from the previous 46.5. The Services PMI, on the contrary, contracted to 50.2 from the 51.1 posted in February.
The EU Manufacturing PMI rose to 48.7 from the previous 47.6, while services output eased from 50.6 to 50.4. The EU Composite PMI posted 50.4, improving from the 50.2 achieved in February. On the price front, both input costs and output charges rose at slower rates.
As for the United States (US) the country published the February Chicago Fed National Activity Index, up to 0.18 in the month from -0.08 in January. Later in the day, S&P Global will release the preliminary estimates of the March US PMIs.
EUR/USD short-term technical outlook
From a technical point of view, the daily chart for the EUR/USD pair shows it trades with modest gains in the 1.0840, as the USD found near-term demand early in the American session. The same chart shows the pair keeps trading above all its moving averages, with a bullish 20 Simple Moving Average (SMA) crossing a flat 200 SMA, both around 1.0745, a strong support area. Technical indicators, in the meantime, retreated further from extreme levels, but hold within positive territory. The Relative Strength Index (RSI) indicator has stabilized around 60, indicating absent directional strength.
In the near term, and according to the 4-hour chart, the EUR/USD pair is finding near-term sellers around a bearish 20 SMA, while the 100 and 200 SMAs head firmly north far below the current level, THE 100 SMA offers dynamic support in the 1.0780 region. Finally, technical indicators remain within negative levels, with neutral-to-bearish slopes, suggesting lower lows are still likely in the day.
Support levels: 1.0830 1.0785 1.0745
Resistance levels: 1.0860 1.0905 1.0950
Author

Valeria Bednarik
FXStreet
Valeria Bednarik was born and lives in Buenos Aires, Argentina. Her passion for math and numbers pushed her into studying economics in her younger years.