EUR/USD: greenback boosted by strong data

EUR/USD Current price: 1.0527
View Live Chart for the EUR/USD
The American dollar advanced with London opening, resulting in the EUR/USD falling to a fresh one-month low of 1.0542. There absence of EU macroeconomic data kept the pair range bound, ahead of Wall Street opening, with the market waiting for US inflation and retail sales figures. Upbeat outcomes sent the greenback further higher across the board, with Retail Sales up 0.4% in the month and by 0.8% ex-autos, in January. Previous month's readings were revised modestly higher. Inflation in the US surged by 0.6% in the first month of the year, doubling expectations of 0.3%. The annual rate printed 2.5%, above the 2.4% expected and previous 2.1%. Additionally, the New York Empire State Manufacturing index for February surged to 18.7 from previous 6.5.
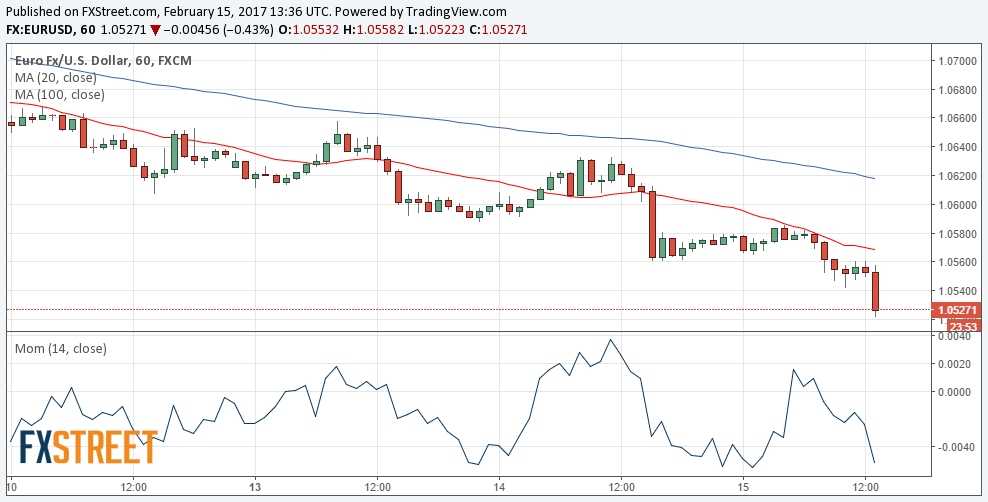
The EUR/USD pair fell down to 1.0521 so far, and the short-term technical picture favors additional declines, given that technical indicators have accelerated their declines, entering oversold territory almost vertically. The 20 SMA in the mentioned time frame has extended its slide, and stands now around a key Fibonacci resistance at 1.0565. In the 4 hours chart, the technical picture is quite alike, with the 20 SMA heading sharply lower well above the current level, and technical indicators gaining downward momentum near oversold levels.
Support levels: 1.0520 1.0480 1.0440
Resistance levels: 1.0565 1.0605 1.0650
GBP/USD Current price: 1.2389
View Live Chart for the GBP/USD
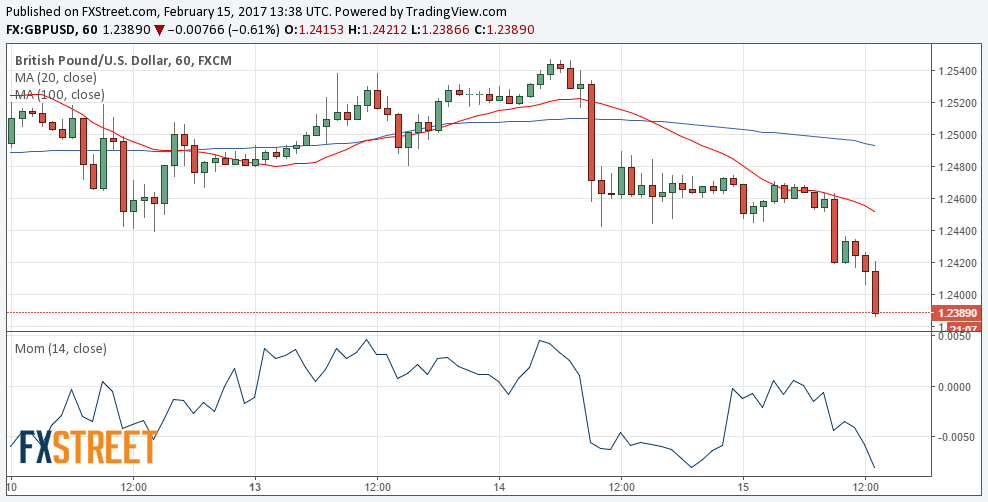
The GBP/USD pair fell to its lowest since February 7, printing 1.2406 following the release of mixed UK employment report, as encouraging headlines were offset by poor wages growth. The unemployment rate for the three months to December remained steady at 4.8%, the lowest in over a decade, while the employment rate for the same period rose to 74.6%, the highest on record. Average hourly earnings including bonus, rose 2.6% in the same period, below previous 2.8%, the slower pace in almost two years. Strong US data sent the pair further lower, now trading in the 1.2380 region, ad poised to retest February 7 low of 1.2346. Technically, the 1 hour chart shows that technical indicators head south within oversold readings, whilst the price is far below a bearish 20 SMA, this last at 1.2450. In the 4 hours chart, the 20 SMA presents a modest downward slope around 1.2495, but technical indicators have also turned south within negative territory, supporting additional declines ahead. The 1.2330/50 region has proved strong multiple times in the past few months, which means that a break below it would result in a steeper decline during the upcoming sessions.
Support levels: 1.2345 1.2300 1.2270
Resistance levels: 1.2430 1.2460 1.2495
USD/JPY Current price: 114.93
View Live Chart for the USD/JPY
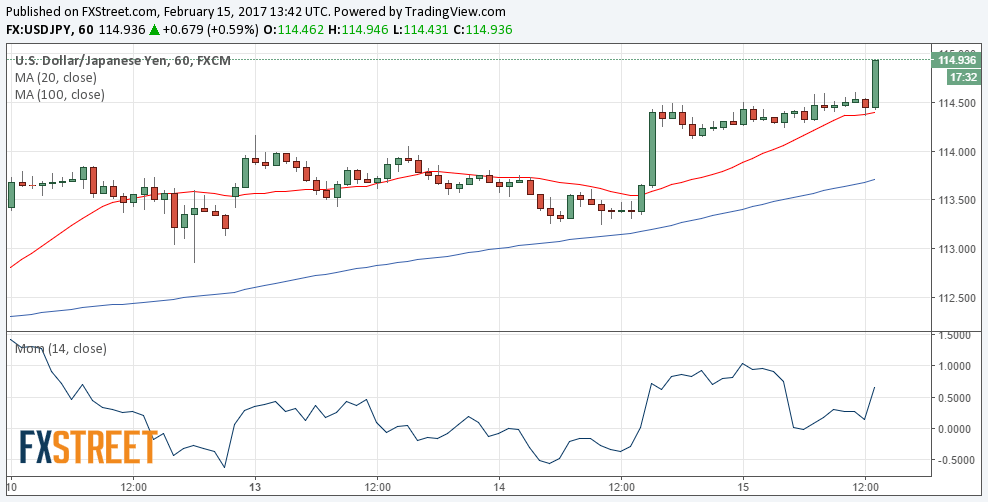
Flirting with 115.00. The USD/JPY pair traded as high as 114.60 during the past two sessions, consolidating Yellen-triggered gains, but jumped towards 114.95, following the release of strong US macroeconomic figures that support the case for a March rate hike. In the US, the Consumer Price Index for increased 0.6% in January on a seasonally adjusted basis, whilst over the last 12 months, index rose 2.5% before seasonal adjustment. The January increase was the largest seasonally adjusted increase since February 2013. The pair has broken above a major Fibonacci, now support around 114.50, but needs to extend its rally beyond 115.00, to maintain the constructive outlook. Short term, technical indicators turned higher, with the RSI indicator at 73 but the Momentum below previous weekly highs. The price is also developing well above a bullish 100 SMA, overall maintaining the risk towards the upside. In the 4 hours chart, the price broke above its 200 SMA for the first time in a month, while technical indicators also head higher near overbought readings, in line with the shorter term outlook.
Support levels: 114.50 114.10 113.70
Resistance levels: 115.10 115.60 116.00
AUD/USD Current price: 0.7646
View Live Chart for the AUD/USD
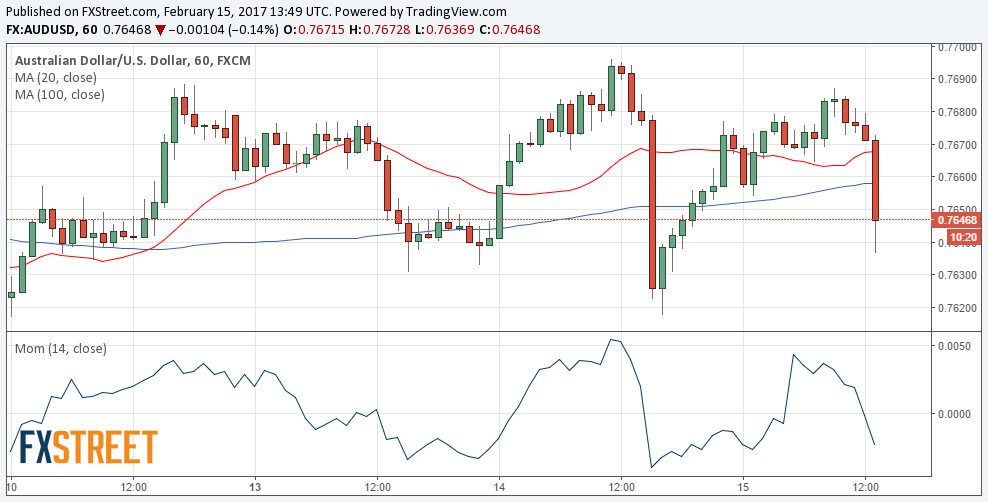
The AUD/USD pair retreated from a daily high of 0.7678 , but trades mid-way within its latest 0.76/0.77 range. The pair has been unable to define a certain directional trend for three weeks already, and the fact that it remains below the base, maintains the bearish potential limited. Anyway, and according to short-term technical readings, the pair is biased lower, as in the 1 hour chart, it broke below a directionless 20 SMA, whilst technical indicators head south below their mid-lines. In the 4 hours chart, the price is also below its 20 SMA whilst indicators turned lower, albeit with limited downward momentum, in line with the ongoing sentiment around the pair.
Support levels: 0.7610 0.7575 0.7530
Resistance levels: 0.7695 0.7735 0.7770
Author

Valeria Bednarik
FXStreet
Valeria Bednarik was born and lives in Buenos Aires, Argentina. Her passion for math and numbers pushed her into studying economics in her younger years.


