EUR/USD Forecast: A test of the 2024 low now appears on the cards
- EUR/USD plummeted to multi-day lows near 1.0730.
- US inflation figures came in above estimates in March.
- The ECB is largely anticipated to keep rates on hold on Thursday.


EUR/USD experienced a sharp defensive move and retreated to the 1.0730 region, or multi-session lows, amidst the unexpected robust rebound in the US Dollar (USD).
Contributing to the Dollar’s uptick, US yields across different timeframes gathered pace and rose to multi-week tops in response to the higher-than-estimated US inflation figures gauged by the CPI for the month of March.
On the latter, bets for a June rate cut were drastically reduced, with a probability of such event hovering around 20% when tracked by the CEM Group’s FedWatch Tool.
Given this scenario, there seems to be a shift in perception regarding the Federal Reserve (Fed), which is now expected to commence its easing cycle later than initially projected, possibly in the fourth quarter. Meanwhile, there's speculation that the European Central Bank (ECB) might initiate interest rate reductions during the summer months.
Looking ahead, the relatively subdued economic fundamentals in the eurozone, coupled with the growing likelihood of a “soft landing” in the US economy, reinforce expectations of a stronger Dollar in the medium term, particularly now that the ECB could reduce its rates earlier than the Fed. In such a scenario, EUR/USD could experience a more significant decline, initially targeting its year-to-date low near 1.0700 before potentially revisiting the lows observed in late October 2023 or early November, dipping below 1.0500.
EUR/USD daily chart
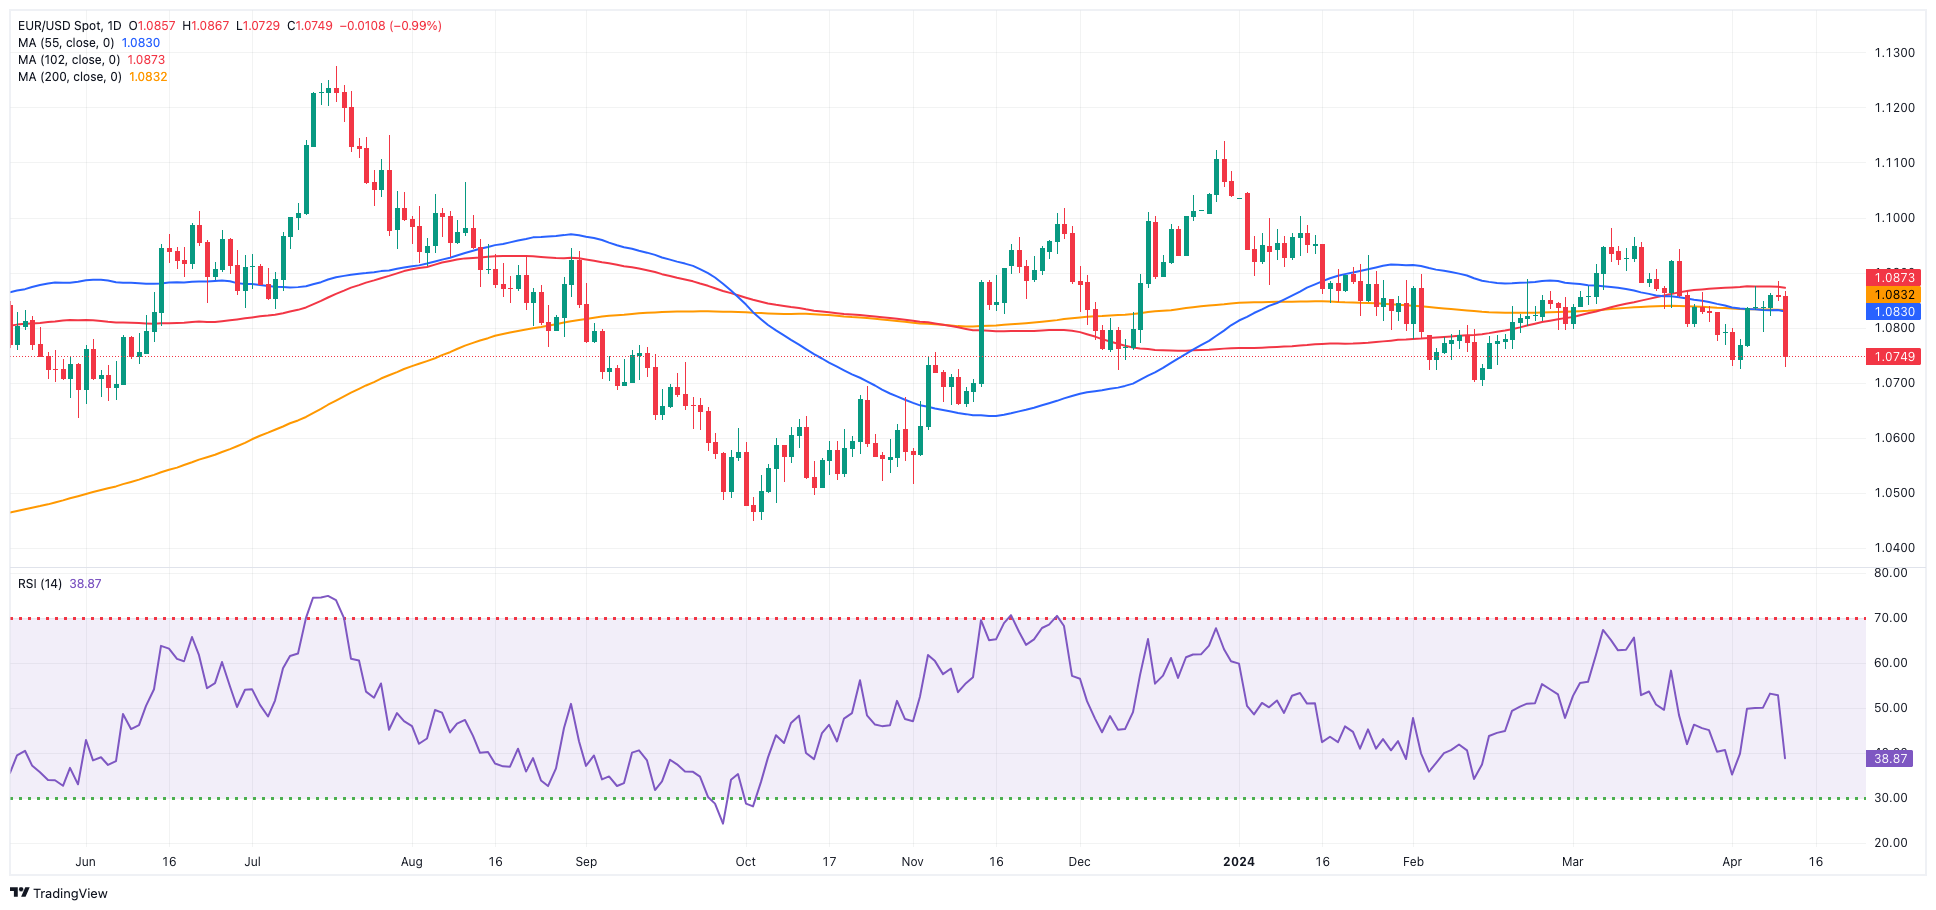
EUR/USD short-term technical outlook
The loss of the crucial 200-day SMA at 1.0831 opens the door to extra losses in the very near term. That said, the next support comes at the April low of 1.0724 (April 2) seconded by the 2024 bottom of 1.0694 (February 14). Down from here is the November 2023 low of 1.0516 (November 1), followed by the weekly low of 1.0495 (October 13, 2023), the 2023 bottom of 1.0448 (October 3), and the round milestone of 1.0400.
On the upside, EUR/USD is projected to find early resistance at the so-far April high of 1.0885 (April 9), followed by the March top of 1.0981 (March 8) and the weekly peak of 1.0998 (January 11), which precedes the psychological barrier of 1.1000. Further increases from here may lead to a test of the December 2023 high of 1.1139 (December 28).
The 4-hour chart reveals a resumption of the bearish bias. That said, initial support comes at 1.0724 and 1.0694. In the opposite direction, the 200-SMA comes at 1.0851 ahead of 1.0885. The Moving Average Convergence Divergence (MACD) remained positive, but the Relative Strength Index (RSI) fell to approximately 32.
Author
Pablo Piovano
FXStreet
Born and bred in Argentina, Pablo has been carrying on with his passion for FX markets and trading since his first college years.

















