EUR/USD: downside looking limited short term

EUR/USD Current price: 1.0655
View Live Chart for the EUR/USD
The American dollar trades marginally higher against most of its major rivals, with a clear exception being the USD/JPY pair which trades below the 113.00 level. The Asian session was extremely quiet amid a scarce calendar, while during the European one, the only relevant macroeconomic figure came from the UK, benefiting the greenback, as retail sales in the kingdom were a big disappointment. In the EU, December current account recorded a surplus of €31.0 billion, above €28.7 billion expected and below a previously revised €36.4B. After Wall Street's opening, the US will release its CB Leading indicator, expected to remain unchanged at 0.5%.

The EUR/USD pair fell down to 1.0636 but bounced back and currently trades in the 1.0655 region, with a limited downward scope according to the 1 hour chart, as the price bounced from its 200 SMA, whilst technical indicators bounced within negative territory, although given that they are still below their mid-lines, and that the 20 SMA caps the upside around 1.0660, there's not much upward room either. In the 4 hours chart, however, the upward potential is clearer, given that technical indicators recovered their bullish strength after correcting overbought readings, whilst the 20 SMA maintains a bullish slope well below the current level, around 1.0620. Still the pair needs to advance beyond the highs around 1.0680 to confirm a new leg higher for today.
Support levels: 1.0625 1.0590 1.0565 1.0520
Resistance levels: 1.0680 1.0720 1.0750
GBP/USD Current price: 1.2426
View Live Chart for the GBP/USD
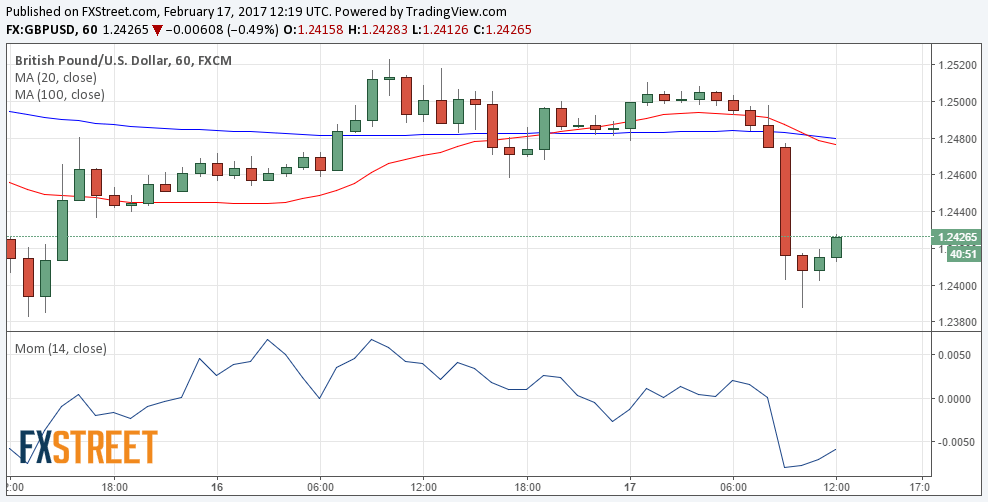
The GBP/USD pair plunged to 1.2387, flirting with its weekly low after the release of UK Retail Sales for January, much worse than expected, whilst December readings were revised lower. Sales fell in the month by 0.3%, while when compared to January 2016, sales rose by 1.5%, below the 3.4% advance expected and the lowest growth since November 2013. Without fuel, monthly sales decreased by 0.2%, whilst the annual reading came in at 2.6% from previous 4.7% and the expected 3.9%. The pair bounced from the mentioned low ahead of US opening, but so far remains below the 1.2430 level, which stands for the 38.2% retracement of the latest bullish run. In the 1 hour chart, technical indicators are bouncing from extreme oversold readings, whilst the price is below a bearish 20 SMA, indicating that the risk remains towards the downside. In the 4 hours chart, technical indicators stand within negative territory, but with no clear directional strength, whilst the 20 SMA gains bearish slope now converging with the static resistance around 1.2470.
Support levels: 1.2380 1.2345 1.2300
Resistance levels: 1.2430 1.2470 1.2520
USD/JPY Current price: 112.80
View Live Chart for the USD/JPY

Yen back in the bullish track. The USD/JPY plummeted below the 113.00 level and traded as low as 112.66 before stabilizing at current levels, resuming its bearish trend after failing to regain the 115.00 earlier this week. There were no fundamental news behind the decline, but lower yields and equities are supporting the yen. From a technical point of view, the 1 hour chart shows that the price is back below the 100 and 200 SMAs, whilst the Momentum indicator heads sharply lower below its 100 level, as the RSI indicator consolidates around 28, supporting the ongoing downward move. In the 4 hours chart, the price has also broken below its moving averages, with the 100 SMA now capping the upside around 113.30, while technical indicators head sharply lower near oversold readings. A break below the 112.50 level, where the pair presents its 100 DMA, should fuel the slide towards 111.95, a major Fibonacci support, en route to 111.60, this month low.
Support levels: 112.50 111.95 111.60
Resistance levels: 113.30 113.80 114.25
AUD/USD Current price: 0.7670
View Live Chart for the AUD/USD
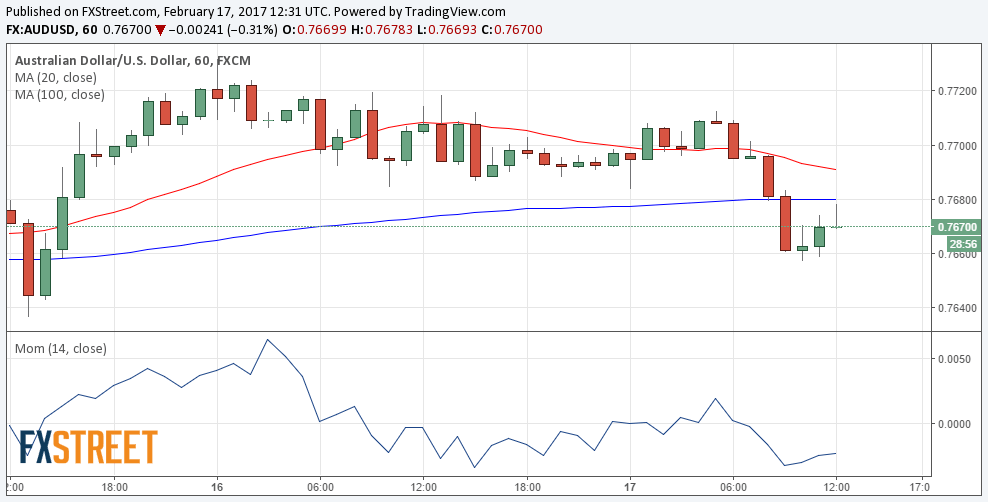
The AUD/USD pair is down from a daily high of 0.7712, but holding within a limited range, and firmly above the 0.7600 mark, the level that buyers have been defending since early February. The short term picture is mildly bearish, as in the 1 hour chart, the price is developing below a bearish 20 SMA, whilst technical indicators have barely corrected oversold conditions before resuming their declines. In the 4 hours chart, however, the neutral stance persists with indicators having turned flat around their mid-lines, and the price a handful of pips below a bullish 20 SMA.
Support levels: 0.7650 0.7605 0.7575
Resistance levels: 0.7695 0.7735 0.7770
Author

Valeria Bednarik
FXStreet
Valeria Bednarik was born and lives in Buenos Aires, Argentina. Her passion for math and numbers pushed her into studying economics in her younger years.


