EUR/USD: dollar's weakness in tight trading

EUR/USD Current price: 1.0584
View Live Chart for the EUR/USD
The week started in slow motion, with major pairs trading within limited ranges during the Asian session, although with risk aversion dominating the scene, amid headlines of a possible Scottish independence referendum. There were no relevant macroeconomic releases during the session, but London brought some relief, as equities trade slightly higher, while news coming from the EU indicate that confidence improved in the region among businesses, as Industrial Confidence surged to 1.3 from previous 0.8, while Services Sentiment advanced from 12.8 to 13.8. Consumer confidence, however, remained subdued, unchanged at -6.2.
Action within the EUR/USD pair was limited ahead of the release of US data, with the pair contained below the 1.0600 level. US Durable Goods Orders for January came in mixed, up by 1.8% after falling by 0.8% in December, although the core reading, ex-transportation, fell by 0.2%, against a 0.5% advance expected, and a previously revised 0.9%. The greenback eased modestly with the news, but market's reaction has been quite limited so far. The US will release its Pending Home Sales, and some minor manufacturing readings during the upcoming hours.
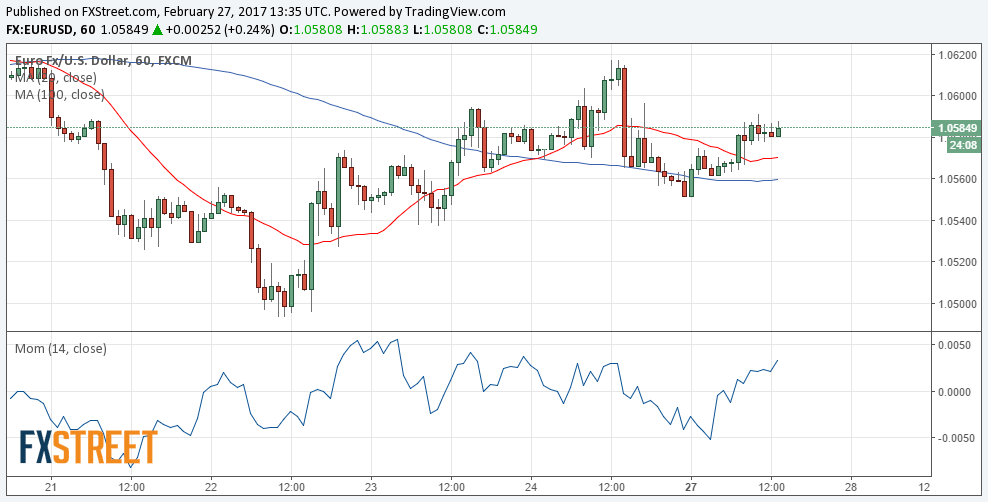
From a technical point of view, the pair presents a modest bullish stance in the 1 hour chart as technical indicators head modestly higher above within positive territory, while developing above its 20 and 100 SMAs. Nevertheless, the price is battling around a daily descendant trend line coming from this year high of 1.0802, while a horizontal 200 SMA caps the upside around the mentioned daily high. In the 4 hours chart, technical readings also favor the upside, as the 20 SMA turned north below the current level, whilst technical indicators head modestly higher within positive territory.
Support levels: 1.0565 1.0520 1.0470
Resistance levels: 1.0600 1.0635 1.0660
GBP/USD Current price: 1.2443
View Live Chart for the GBP/USD
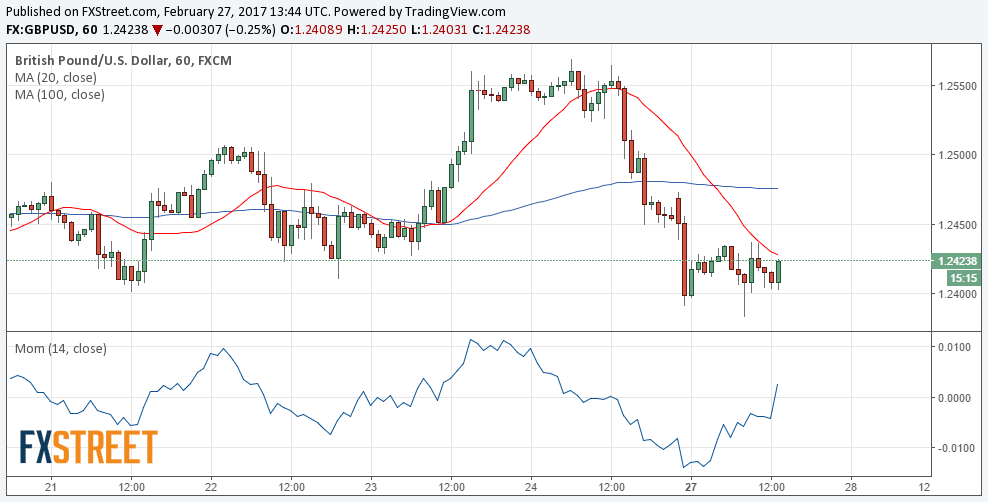
The GBP/USD pair fell down to 1.2383 early London session, weighed by speculation about an upcoming Scottish independence referendum. There are loads of headlines about the matter, but little official information. True, Scotland PM Nicola Sturgeon has said that a referendum is "highly likely," after UK's PM Theresa May confirmed that the kingdom is going for a hard-Brexit. For the most, comments and rumors point out that the UK government is preparing some sort of emergency plan, in the case the referendum actually happens. The pair bounced from the mentioned low but met selling interest on approaches to 1.2440, the immediate resistance. In the 1 hour chart a strongly bearish 20 SMA caps the upside in the 1.2430 region, while technical indicators have recovered from oversold levels, with the Momentum already within positive territory but the RSI at 41, this last limiting chances of a stronger recovery. In the 4 hours chart, however, the technical bias favors the downside, with the price below its moving averages, and indicators heading modestly south within negative territory.
Support levels: 1.2380 1.2345 1.2300
Resistance levels: 1.2440 1.2490 1.2535
USD/JPY Current price: 112.37
View Live Chart for the USD/JPY
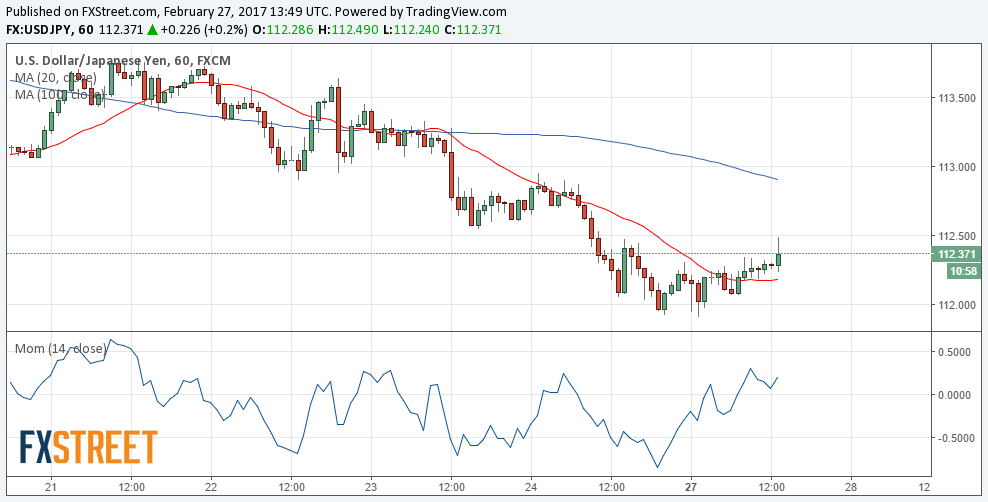
Upside limited, but still yield-dependent. The USD/JPY pair fell down to 111.91 at the beginning of the day, surpassing Friday's one by a couple of pips, but traded some pips above the 112.00 figure for most of the day, as investors waited for US data. The pair spiked up to 112.48 on US Durable Goods Orders headline, but retreated as the core reading disappointed. Given that the dollar is broadly weak, seems unlikely the pair will advance further, although the upcoming direction will depend on yields' movements rather than anything else. Technically, the 1 hour chart shows that the 100 and 200 SMAs have gained downward strength well above the current level, while the RSI indicator holds around 50 and the Momentum bounces from its 100 level, still holding below previous daily highs. In the 4 hours chart, indicators have posted modest recoveries from oversold levels, but remain well below their mid-lines, while the price remains far below the 100 and 200 SMAs, indicating that the upward potential remains well-limited.
Support levels: 111.95 111.60 111.20
Resistance levels: 112.50 112.90 113.30
AUD/USD Current price: 0.7678
View Live Chart for the AUD/USD
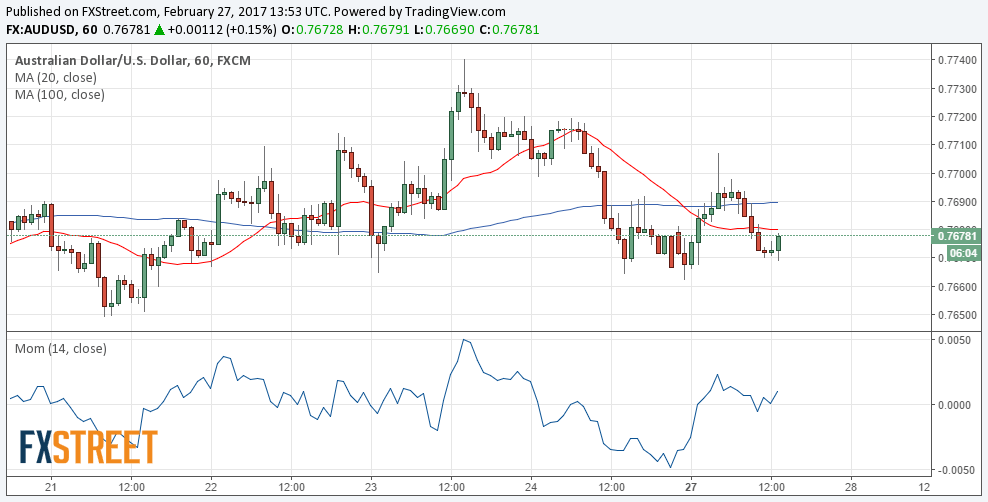
The AUD/USD pair spiked up to 0.7709 early Monday, but eased from the level, trading however, at the higher end of its latest range, with the pair bouncing from 0.7669 ahead of the US session. The upward potential seems limited in the short term, as the price is so far capped by a flat 20 SMA, while technical indicators present modest upward slopes, not enough to confirm a strong advance. In the 4 hours chart, the price is developing below a modestly bearish 20 SMA, while indicators head nowhere within negative territory, also suggesting the upside will likely remain limited.
Support levels: 0.7660 0.7610 0.7575
Resistance levels: 0.7710 0.7735 0.7770
Author

Valeria Bednarik
FXStreet
Valeria Bednarik was born and lives in Buenos Aires, Argentina. Her passion for math and numbers pushed her into studying economics in her younger years.


