|

Chart of the week: GBP/USD bulls target a grind higher to 1.3850s

  • GBP/USD bulls in control, seeking a close around December 2017 high is at 1.3550.
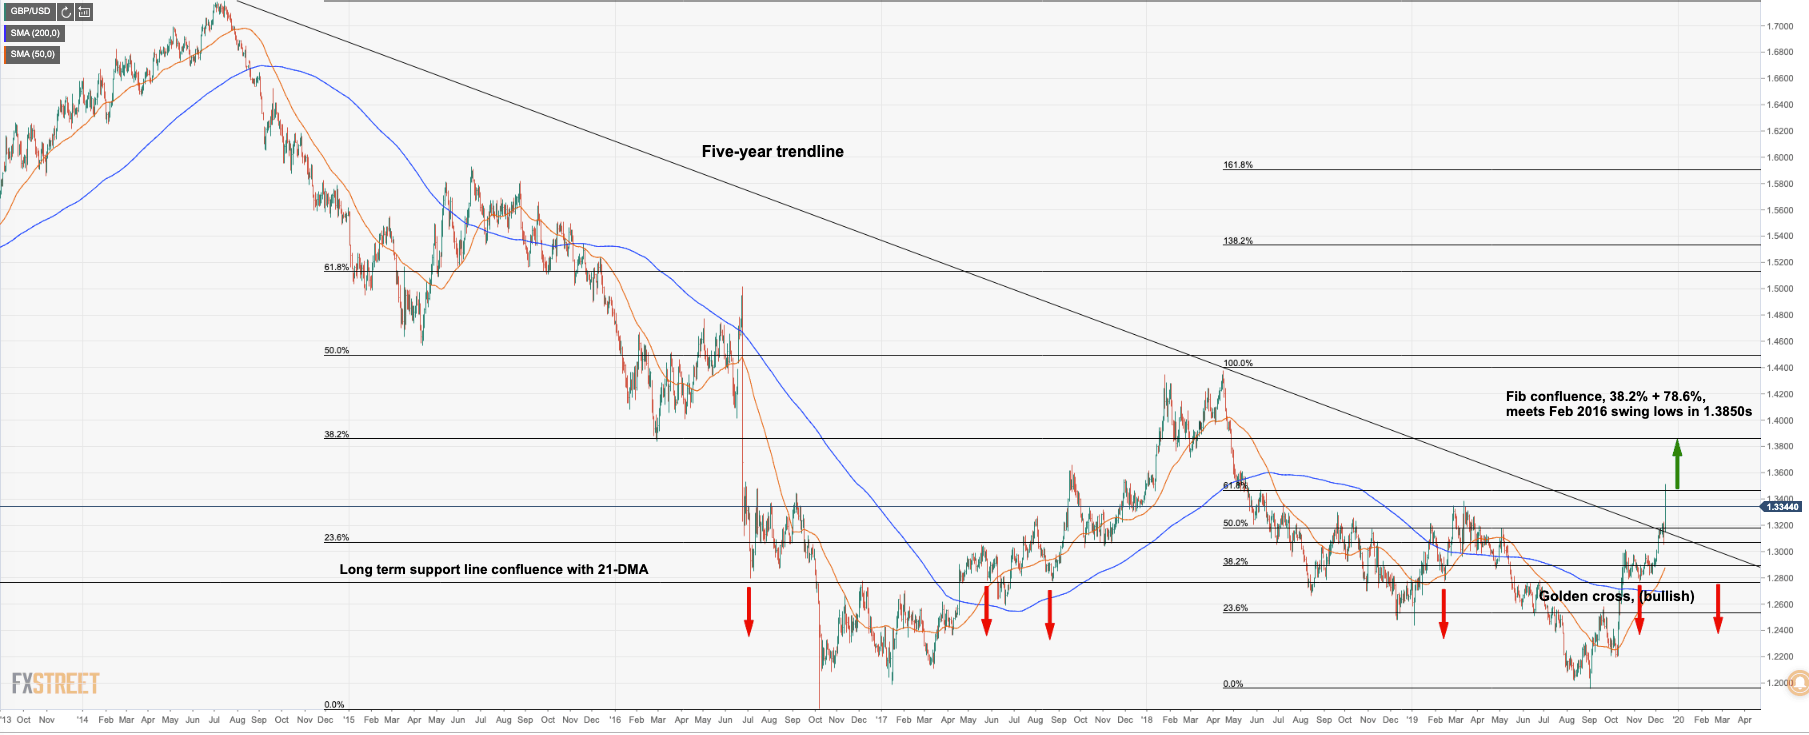
  • The next target comes in the1.38s where there is a confluence of Fibonacci retracement targets and the February 2016 swing lows.
  • While below 1.3351, as being the February and March highs, bears can focus on a break below 1.3305, (S1), 1.3270 late March highs and the 1.3217 January peak.
  • The 200-day moving average is a critical downside target at 1.2699 (just below the golden cross). 

Valeria Bednarik, the Chief Analyst at FXStreet, argues that the GBP/USD pair is bullish according to the daily chart:

"Despite the sharp retracement from multi-month highs, the pair is trading around its former yearly highs. Technical indicators in the mentioned chart maintain their upward slopes within overbought levels, while the pair is further above a firmly bullish 20 DMA.  

GBP/USD daily chart

  • Support levels: 1.3305 1.3270 1.3225.
  • Resistance levels: 1.3365 1.3400 1.3440.

Bullish and bearish technical outlooks

  • Bullish: Following a 2.5% rally post the UK elections and a high of 1.3515, the bulls extended the upside above the golden cross and five-yar downside resistance line. Bull can now aim for a close above the 1.35 handle (the December 2017 high is at 1.3550). Bulls will hunt down the high 1.38s where there is a confluence of Fibonacci retracement targets and the February 2016 swing lows. However, between there, we have the September 2017 peak at 1.3658 as well as the February 2018 low at 1.3712. On the next major leg up, bulls will target the double tops of the first half of 2018 around 1.4350. 
  • Bearish: While below 1.3351, as being the February and March highs, bears can focus on a break below 1.3305, (S1), 1.3270 late March highs and the 1.3217 January peak. Below here, the 21-day moving average and long term support line are located in the low 1.30s which meet the 21 October highs of 1.3012. The 200-day moving average is found down at 1.2699 (just below the golden cross). 

GBP/USD

Overview
Today last price1.3344
Today Daily Change0.0000
Today Daily Change %0.00
Today daily open1.3344
 
Trends
Daily SMA201.3024
Daily SMA501.2877
Daily SMA1001.2565
Daily SMA2001.2699
 
Levels
Previous Daily High1.3515
Previous Daily Low1.3149
Previous Weekly High1.3515
Previous Weekly Low1.3051
Previous Monthly High1.2986
Previous Monthly Low1.2769
Daily Fibonacci 38.2%1.3375
Daily Fibonacci 61.8%1.3289
Daily Pivot Point S11.3157
Daily Pivot Point S21.297
Daily Pivot Point S31.2791
Daily Pivot Point R11.3523
Daily Pivot Point R21.3702
Daily Pivot Point R31.389

Author

Ross J Burland

Ross J Burland, born in England, UK, is a sportsman at heart. He played Rugby and Judo for his county, Kent and the South East of England Rugby team.

More from Ross J Burland
Share:

Editor's Picks

GBP/USD loses momentum, flirts with 1.3200

GBP/USD is struggling to maintain its positive bias on Thursday, retreating toward the 1.3200 region in response to the pick in the buying interest around the Greenback. That said, Cable remains under scrutiny as cautious market sentiment keeps investors focused on the US-Iran conflict and political effervescence in the UK.

EUR/USD trims gains, challenges 1.1400

EUR/USD now gives away part of its earlier advance, receding toward the 1.1400 contention zone on Thursday. Meanwhile, the pair’s recovery comes amid extra losses in the US Dollar, at the time when while investors continue to monitor developments in the Middle East and sentiment surrounding global technology stocks.

Gold remains bid and close to $4,100

Gold accelerates its recovery and approaches the key $4,000 mark per troy ounce at the end of the week, adding to Thursday’s advance. However, expectations for a hawkish Fed remain steady and keep the yellow metal’s potential upside contained.

Crypto Today: Bitcoin at $60,000, Ethereum at $1,500, and XRP at $1 face a make-or-break test

Bitcoin (BTC), Ethereum (ETH), and Ripple (XRP) are trading in the red on Friday after three consecutive days of losses, testing their respective make-or-break support levels.

Week ahead – NFP report to challenge Dollar strength and the hawkish Fed

Dollar strength dominates markets, as the hawkish Fed overshadows geopolitics and lower oil prices. NFP week could drive September Fed hike expectations and boost market volatility. The euro lacks fresh bullish catalysts, all eyes on the preliminary inflation report and the ECB Forum.

Regime change: Inside Kevin Warsh's first move to make the Fed unreadable on purpose

The rate did not move. That was the least interesting thing about Kevin Warsh's first meeting in charge of the Fed. The FOMC held its benchmark at 3.50%-3.75% for the fourth straight meeting, exactly as priced, and then the new chair used his first press conference to dismantle the machinery the market has leaned on for a decade.