Bitcoin, Litecoin and Ripple price prediction: ready to face the channels' roofs
- The main cryptos move in the upper range of the channels that restrain them since December maximums.
- BTC/USD keeps developing a head and shoulders bottom pattern that favors the laterality needed for further developments.

The hackers that stole $530M in NEMs spend $84.7M on the dark web
As Tanya Abrosimova mentioned earlier today, news about the hackers that stole $530M in NEMs keep coming, as they turn the fruit of their thefts into common currency. Using the dark web to offer discounts in the XEM/USD price, they are getting rid of the loot to receive other cryptos that are sold immediately.
This acts highlight the paradox of cryptocurrencies, when the anonymity that they offer becomes a disadvantage as it hinders the criminal's follow-up.
BTC/USD 240 min
The technical situation is quite similar for the main actors in the crypto theater. The three pairs we analyze today are moving in the upper third of the bearish channel that restrains them since December maximums.
BTC/USD continued its bullish trend after a first failed try to break $10,000. During the weekend, it managed to trade above the $11,000, the neckline of the head and shoulders bottom patterns we described on past week. Given the current situation, Bitcoin doesn't seem ready to try a bullish break. Instead, continuing the current technical pattern seems much more probable, with the price drawing the next shoulder before initiating a bullish trend.

The MACD is showing an exhaustion profile, crossed to the downside but very horizontal. Hence, we can't dismiss a bullish test on the upper line of the bearish channel. Excursions to the 100 and 50 simple average levels, around $10,000, are very likely.
The Directional Movement Index is still showing a slight advantage for buyers, although sales are at similar levels. The ADX is clearly indicating a weakening of the bullish trend.
Above the current level, there is a first resistance at $11630, followed by $12989 and $14076. Below, the first support is at $9950. If broken, it would go down to the next main support at $9500.
LTC/USD 1D
Similar situation for LTC/USD, that saw its bullish trend halted at $236.50, the Fibonacci's 50% recoil of the previous movement. On the European morning, it had retreated to $221.67, with an important support at $204.73, where the 38.2% level stands.
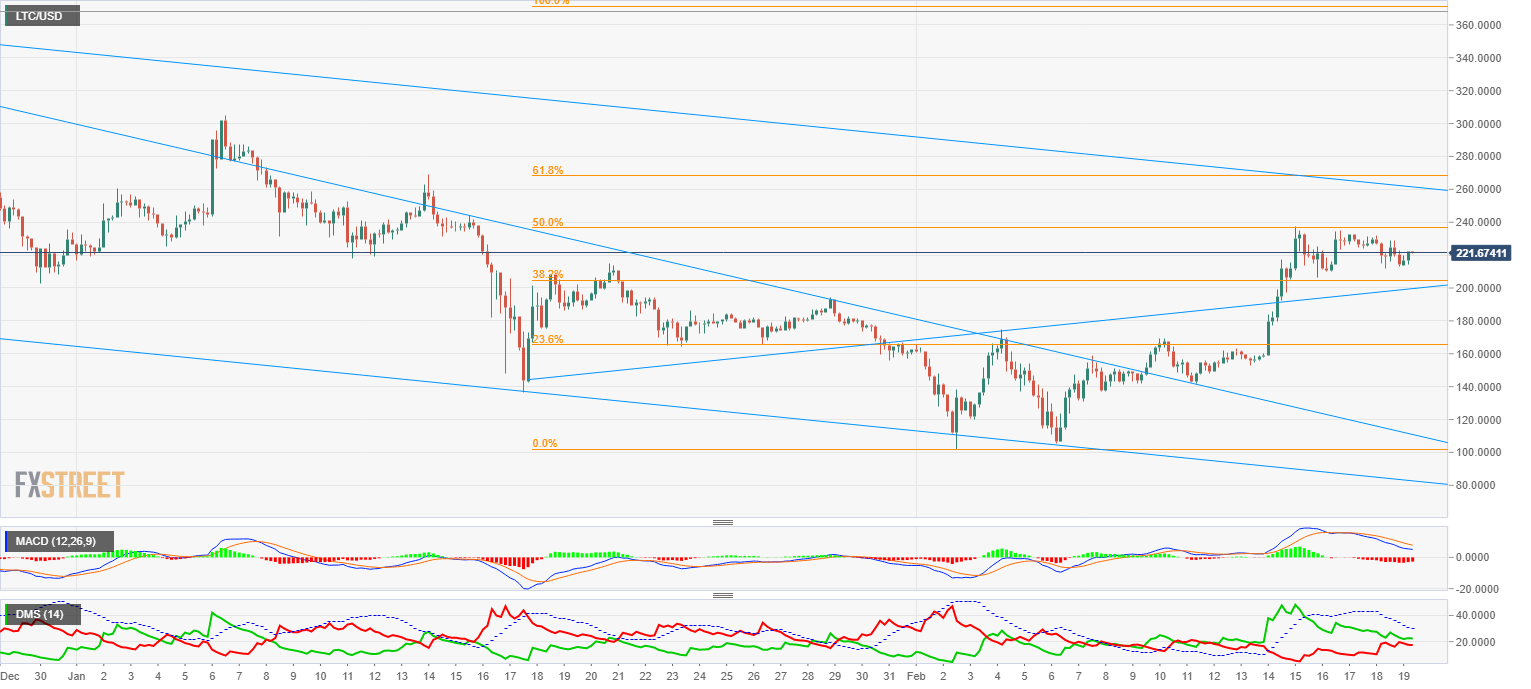
The MACD shows a development slightly more advanced than Bitcoin's. After smoothly sliding to the 0, it is now softening the slope and it seems to be preparing to rest on the equilibrium level.
The Directional Movement Index is similar to BTC/USD, with buyers and sellers on similar levels, with a slight advantage for the formers. The ADX also shows a trend weakening, something expected after the good bullish trend from last sessions.
Above, the first resistance is at $236.54, that would open the door to attack the bearish channel line at $260 if broken. Above, the first support to watch out is at $204, followed by the $198-$200. This is a zone where several technical supports converge, and it must be respected to maintain the bullish tone.
XRP/USD 240 min
Ripple was the main actor at the beginning of the week thanks to its huge rises, but has weakened since then, following the same bullish pattern than the rest. It is now laying on a trendline that it must keep following if it is to continue the rises. If the trend is lost to the downside, it would have room until the $0.96 level, its main support. If broken, Ripple's price would enter a bearish scenario in the mid-term.
Compared to Bitcoin and Litecoin, Ripple has less room to move, and it is now in a zone where several technical levels converge: Fibonacci levels; mid-term trendlines, specifically the bearish channel that rules the price since December; and the short-term bearish trend. The scenario is complex, with significant levels in a relatively small price range.
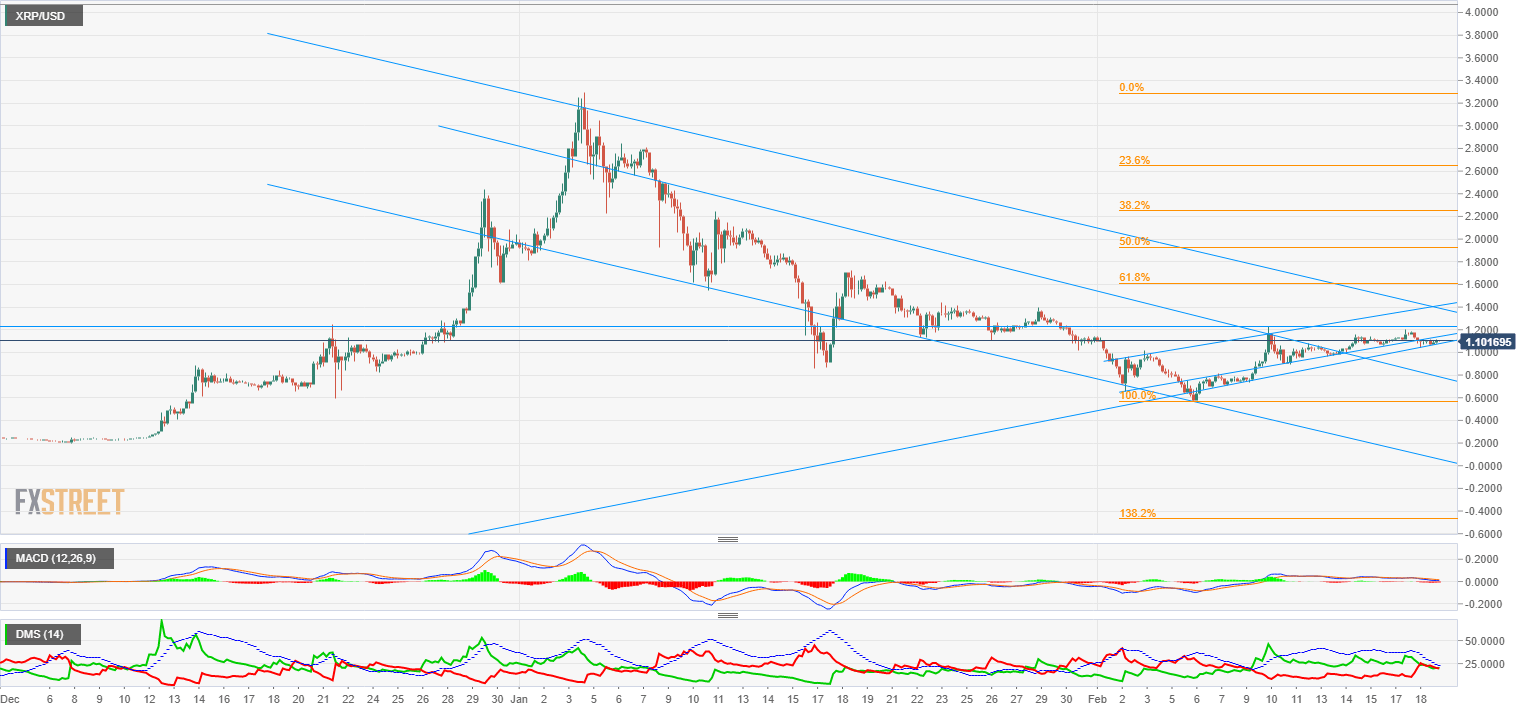
The MACD is similar to the ones described previously. It may be more advanced, since it is resting almost at the 0.
The Directional Movement Index shows total equilibrium. In this case, the ADX has decreased considerably, and its position is much better to challenge a new increase.
Above the current levels, the first goal is at $1.1380, followed by $1.2283. If broken, the next resistance is at $1.3943, the channel's roof and January 28 maximum. Below, the first support is at $1.069, followed by an important support at $0.96. If lost, Ripple's price would go down to the bearish trendline at $0.90.
Author

Tomas Salles
FXStreet
Tomàs Sallés was born in Barcelona in 1972, he is a certified technical analyst after having completing specialized courses in Spain and Switzerland. He expanded his technical training following the guidance of great experts on the financial markets.


